Decred Blockchain Analysis - Part 2 PoW wow

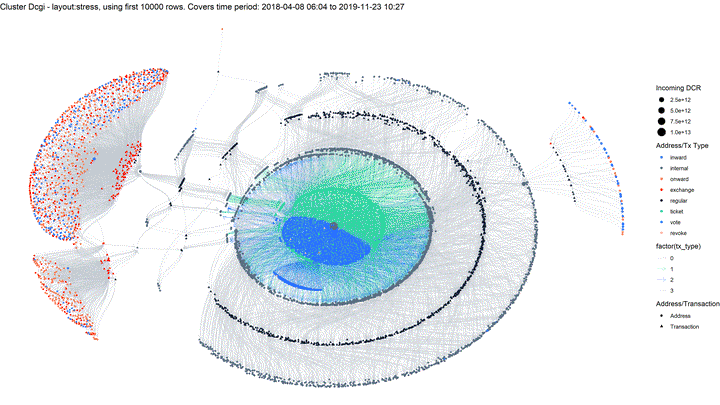
Getting tangled up in the Decred chain
Since my first report about the Decred blockchain data, I have descended into its depths in an effort to understand what we can learn about the network. This work has progressed in three directions that have some overlap:
- Clustering Decred’s addresses to see which addresses spend funds or buy tickets together, thus probably belonging to the same wallet.
- Looking at exchanges and how to identify exchange-related transactions - these are key platforms within the ecosystem so it is important to be able to identify them in the data.
- Looking at the mixing process and the DCR which engages in it.
My plan for the second report was to finish the clustering and provide a detailed history of the Decred chain, but clustering all of the Decred miners/stakeholders/contractors/exchanges at the same time is a deep deep rabbit hole. I have gone through many iterations of this process, and for the last few it has been difficult to identify any errors - but I still eventually find some curious bits of data that don’t make a lot of sense, so it’s not 100% reliable yet.
While I still plan to write this kind of detailed history, there’s a long way to go on it, and it will be fairly long when it is done. I have reached a point though where the exploration is quite interesting so I will be writing up short reports which give some insight into different aspects of on chain activity as I go, moving forward.
The first of these reports looks at the top miners from 2019-2020 (firmly ASIC era), to demonstrate some of the tools I have developed and see what kind of picture we can draw with the available analytics. I stopped the clock for data collection for this report on Jan 9 2021.
Get to know the miners
To start with, I took all the PoW rewards for this period and tracked their flow for 2 hops, this should cover hop 0 (block reward) to hop 1 (for pools, often a pool payout or internal movement before), on to hop 2.
There have been 192 addresses which received PoW rewards directly from the coinbase, and these in turn sent the freshly minted DCR on to 242,226 addresses. The typical arrangement would be for the coinbase transaction to mint DCR to an address which the pool always uses (the 192), then the pool makes transactions which send this DCR to participants - but there is considerable variation in how pools manage this process, as we shall see.
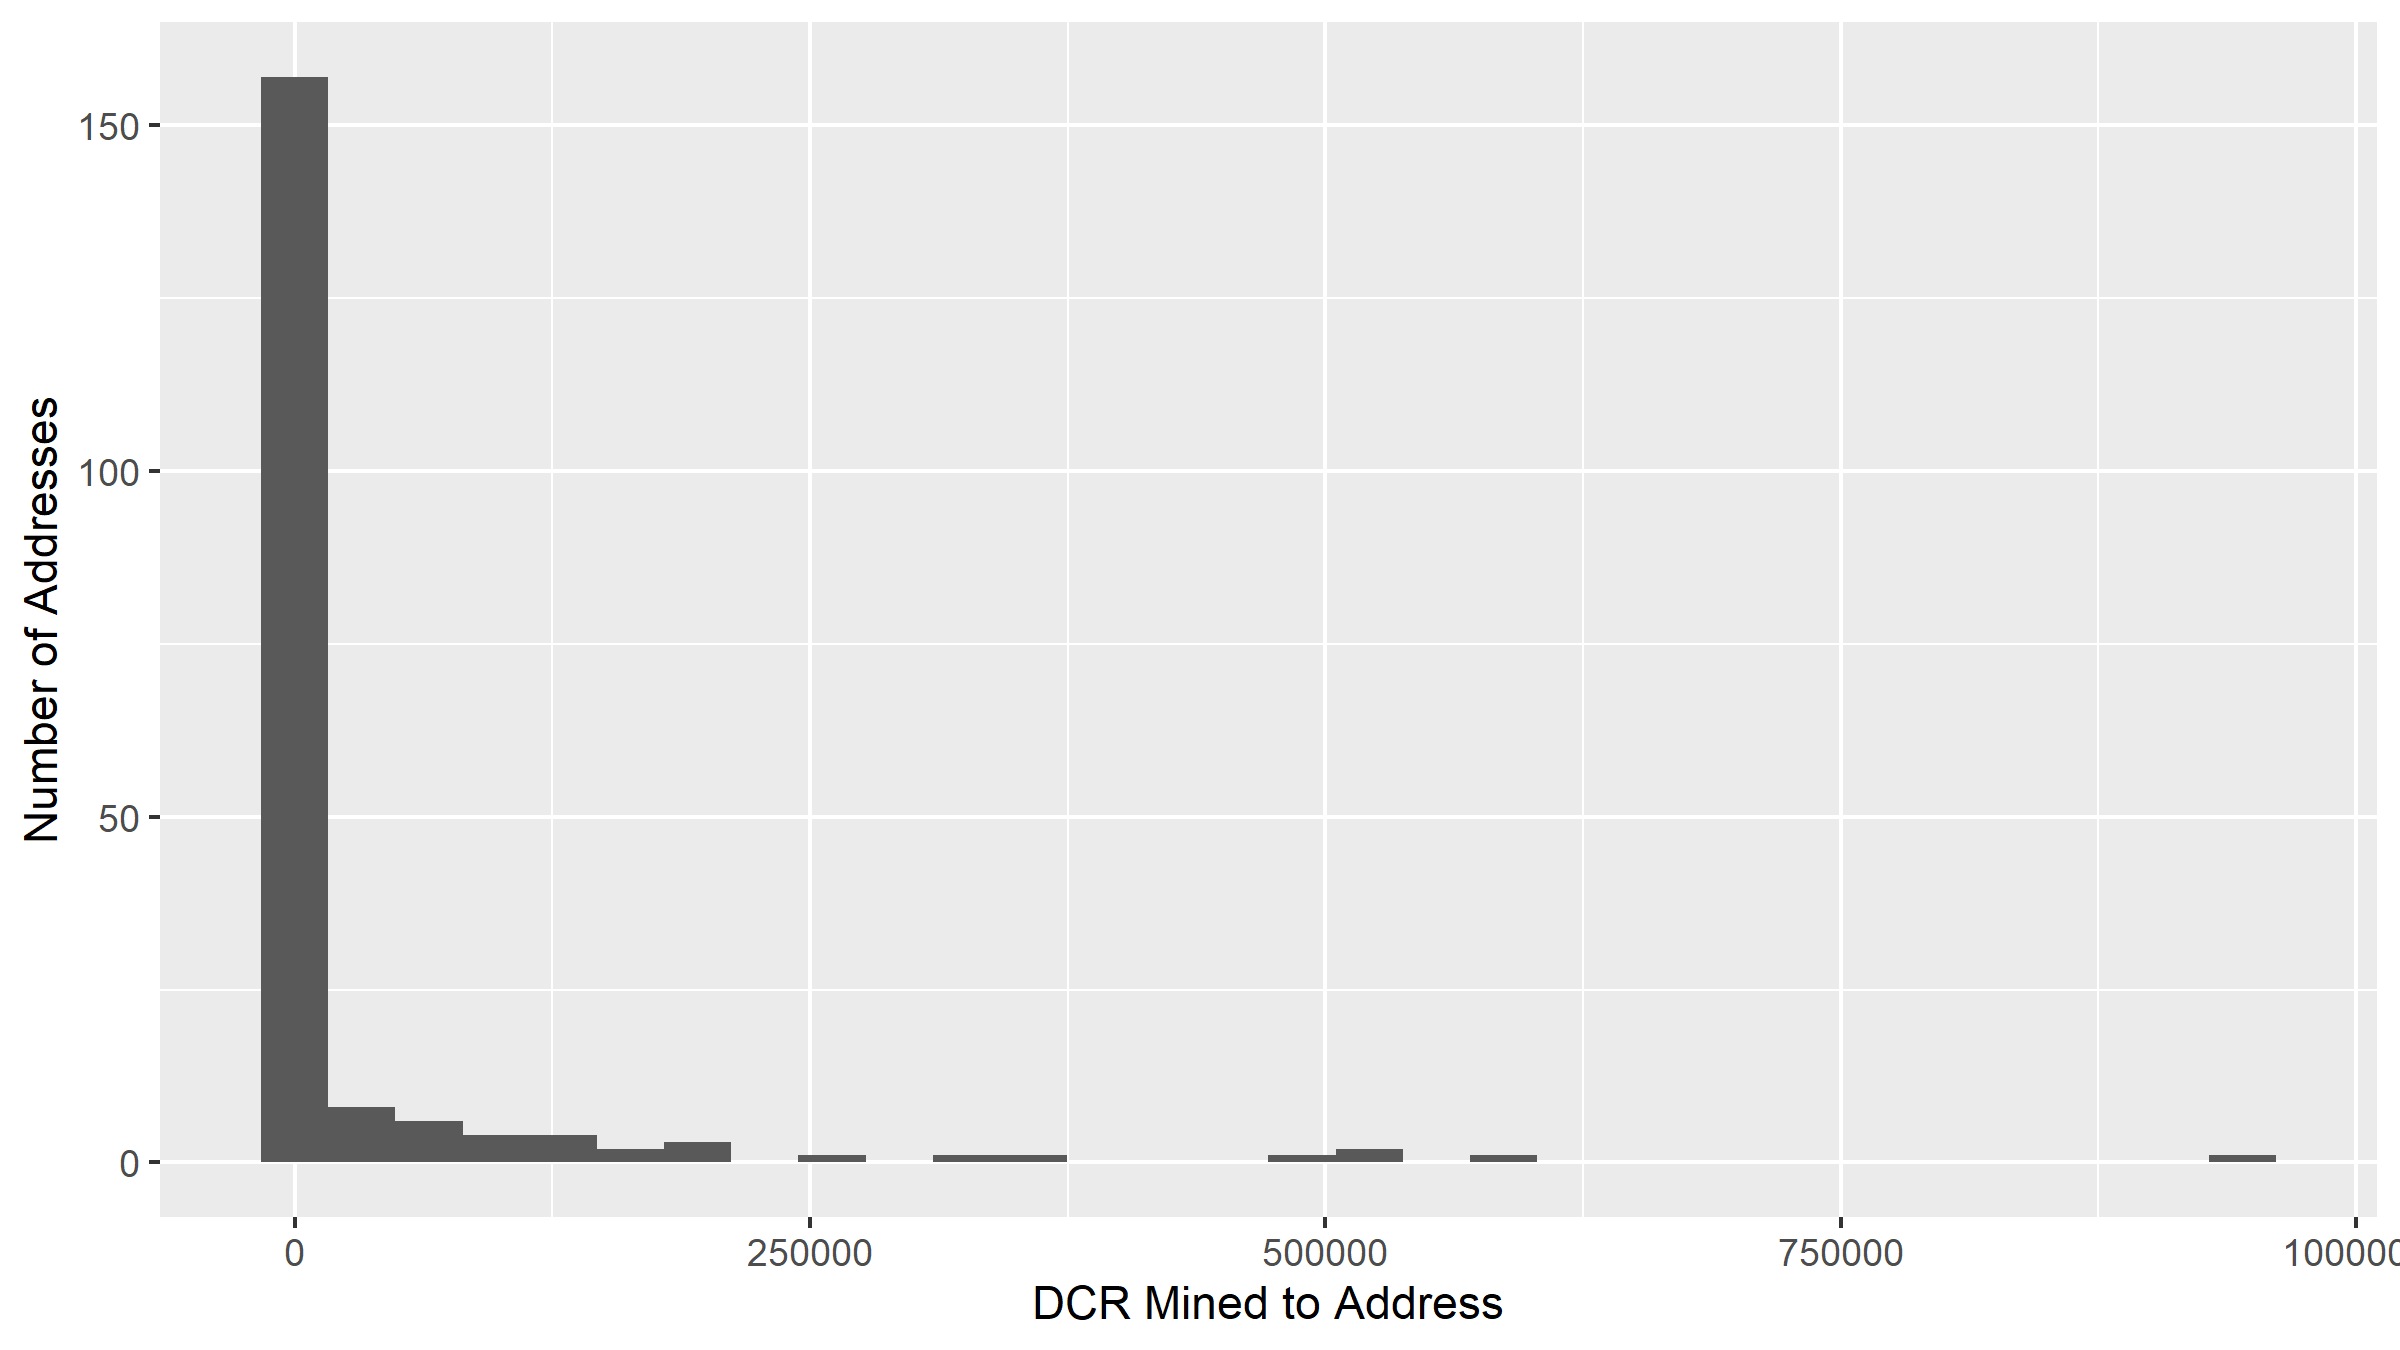
Histogram showing distribution of PoW rewards to addresses.
I ran my clustering code on this set of addresses that received PoW rewards at hop 0 or 1 - it takes an address, looks for all its common inputs to transactions and at its ticket buys and any extra addresses it can learn through those, repeats that a for a few cycles until it stops finding new addresses, and stores it all in the database.
I have selected the clusters to look at in more detail according to amount of PoW rewards earned since 2019, the top 5 in terms of direct coinbase recipients (you won’t believe number 3!!!), which should cover mining pools, and the top 5 in terms of DCR received from coinbase transactions (should cover miners using pools).
Initially I looked to separate pools and miners from the outset, but the presence of solo miners and some variation in how pools manage payouts made it a little tricky to differentiate these just by looking at basic measures. So, the plan is to talk through the process of figuring out which is which using the data, as that should also be more instructive for readers.
Important: The clusters are selected based on mining rewards from 2019 onwards, but once the clusters were identified I have used the full historical data to compile their summary information.
Network view
Staring at tables of addresses and transaction hashes and trying to follow a flow between these is hard on the mind, so I have on a few occasions looked into methods of visualising these networks. Conventional methods of drawing out the nodes and edges in a network do not scale well to the size of these clusters. Most of the time when I try one of these it just thrashes my machine for hours before crashing or I give up and kill it. When the graphs do draw, they’re usually incomprehensible.
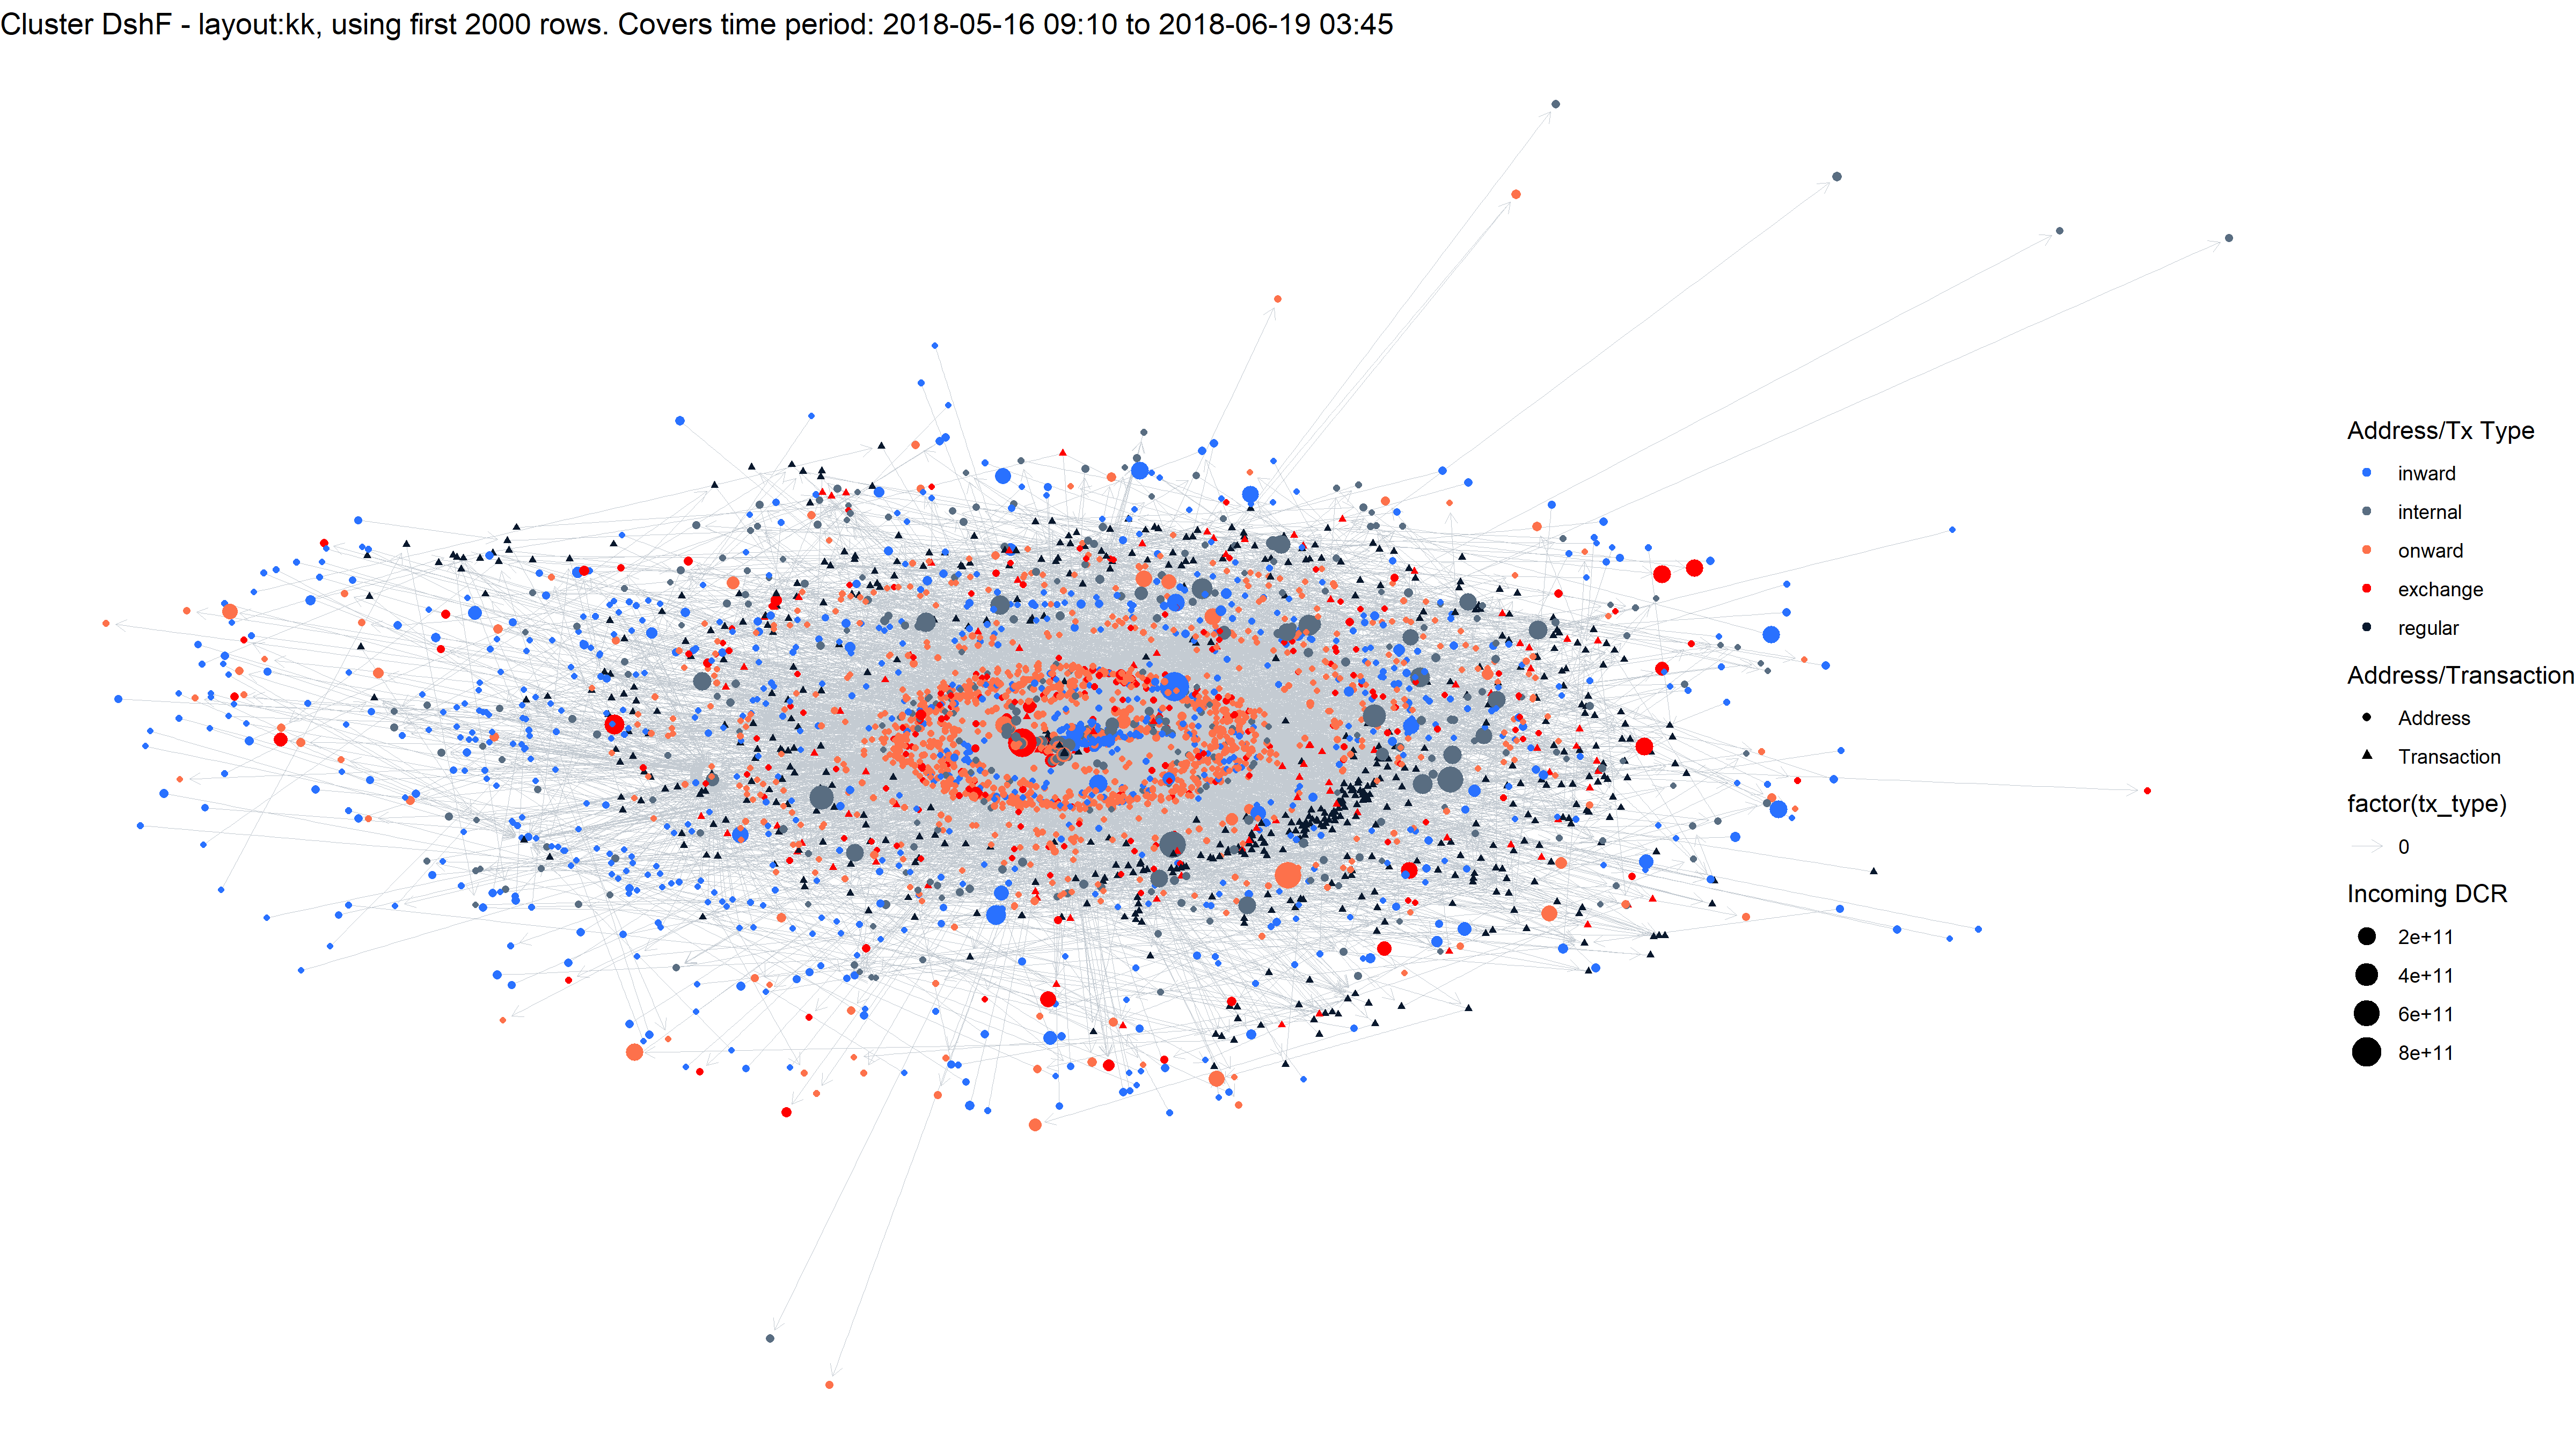
While experimenting with smaller samples recently to learn how to control layouts and such, I realized that these work quite well to give a sense of how the miner or pool organises their addresses and transactions. For these mining clusters taking just the first 2,000 - 20,000 rows of the addresses table (inputs/outs for transactions) seems to strike a good balance between having a representative sample that illustrates how the DCR is flowing, and being able to draw it. The major limitation would be if the pool changed its structure later on, which would not be represented in these graphs. All the graphs can be clicked to expand, and for these network plots it’s probably a necessity to make out anything that’s represented.
The big decision when representing the flow of DCR as a network is whether to use a one or two-mode network. I have opted for two-mode here, with Addresses and Transactions being the two different types of node. DCR flows from an address to a transaction, and from a transaction to new addresses. I have also experimented with one-mode networks (where only address nodes exist and transactions are represented as edges between them) but the mass of connections this results in is difficult to visualise.
The type of network in the visualizations is a very basic ego network centred on the cluster’s addresses, it is a slightly unconventional ego network because I used my clustering technique to define the boundary of the network, then only extended one edge from the nodes within this “ego”.
The network visualizations use the first 2,000 - 20,000 inputs/outputs from the cluster’s addresses, and go one hop out in each direction to see if inputs came from cluster addresses, or outputs went to cluster addresses. In these cases (the majority of edges) the DCR is moving between addresses controlled by the same wallet. Where the inputs do not come from a cluster controlled address, I have marked these as “inward” nodes - coinbase transactions are a special type of inward node and I have given them their own color. Where outputs from cluster transactions do not go to cluster controlled addresses, I have marked these as “onward” nodes. Onward addresses that match known exchange addresses have been highlighted with their own color.
Network visualisation is a recent addition to my exploration toolset, but now that I have methods of producing this kind of ego network there are many other clusters to look at and network based analyses I can use. Each cluster below has a network graph with the same colour parameters. I have varied the number of rows of data to use to seed the ego network and chosen different levels for each cluster, the maximum legible number (and point where they get very slow to draw) depends on how much the cluster’s transactions fan out. I am also experimenting with layouts, and these can have a big effect on how the networks look, the layout is given in the title (along with number of rows).
Coinbase Top 5
1 - DsiD
This cluster was first seen in Jan 2019 and was still active in Jan 2021, it has received 987k DCR of PoW rewards from mining 53,766 blocks. The cluster controls 1,109 addresses, there’s the main one that receives PoW rewards and the others are change addresses from payout transactions, the change loops back to be used with further payouts.

DCR balance of the DsiD cluster
The balance for this cluster’s addresses never gets too large. Another useful indicator of what the cluster is doing is to look at the regularity of its behaviour. Very regular behaviours repeated for months or years are a sign of automation.
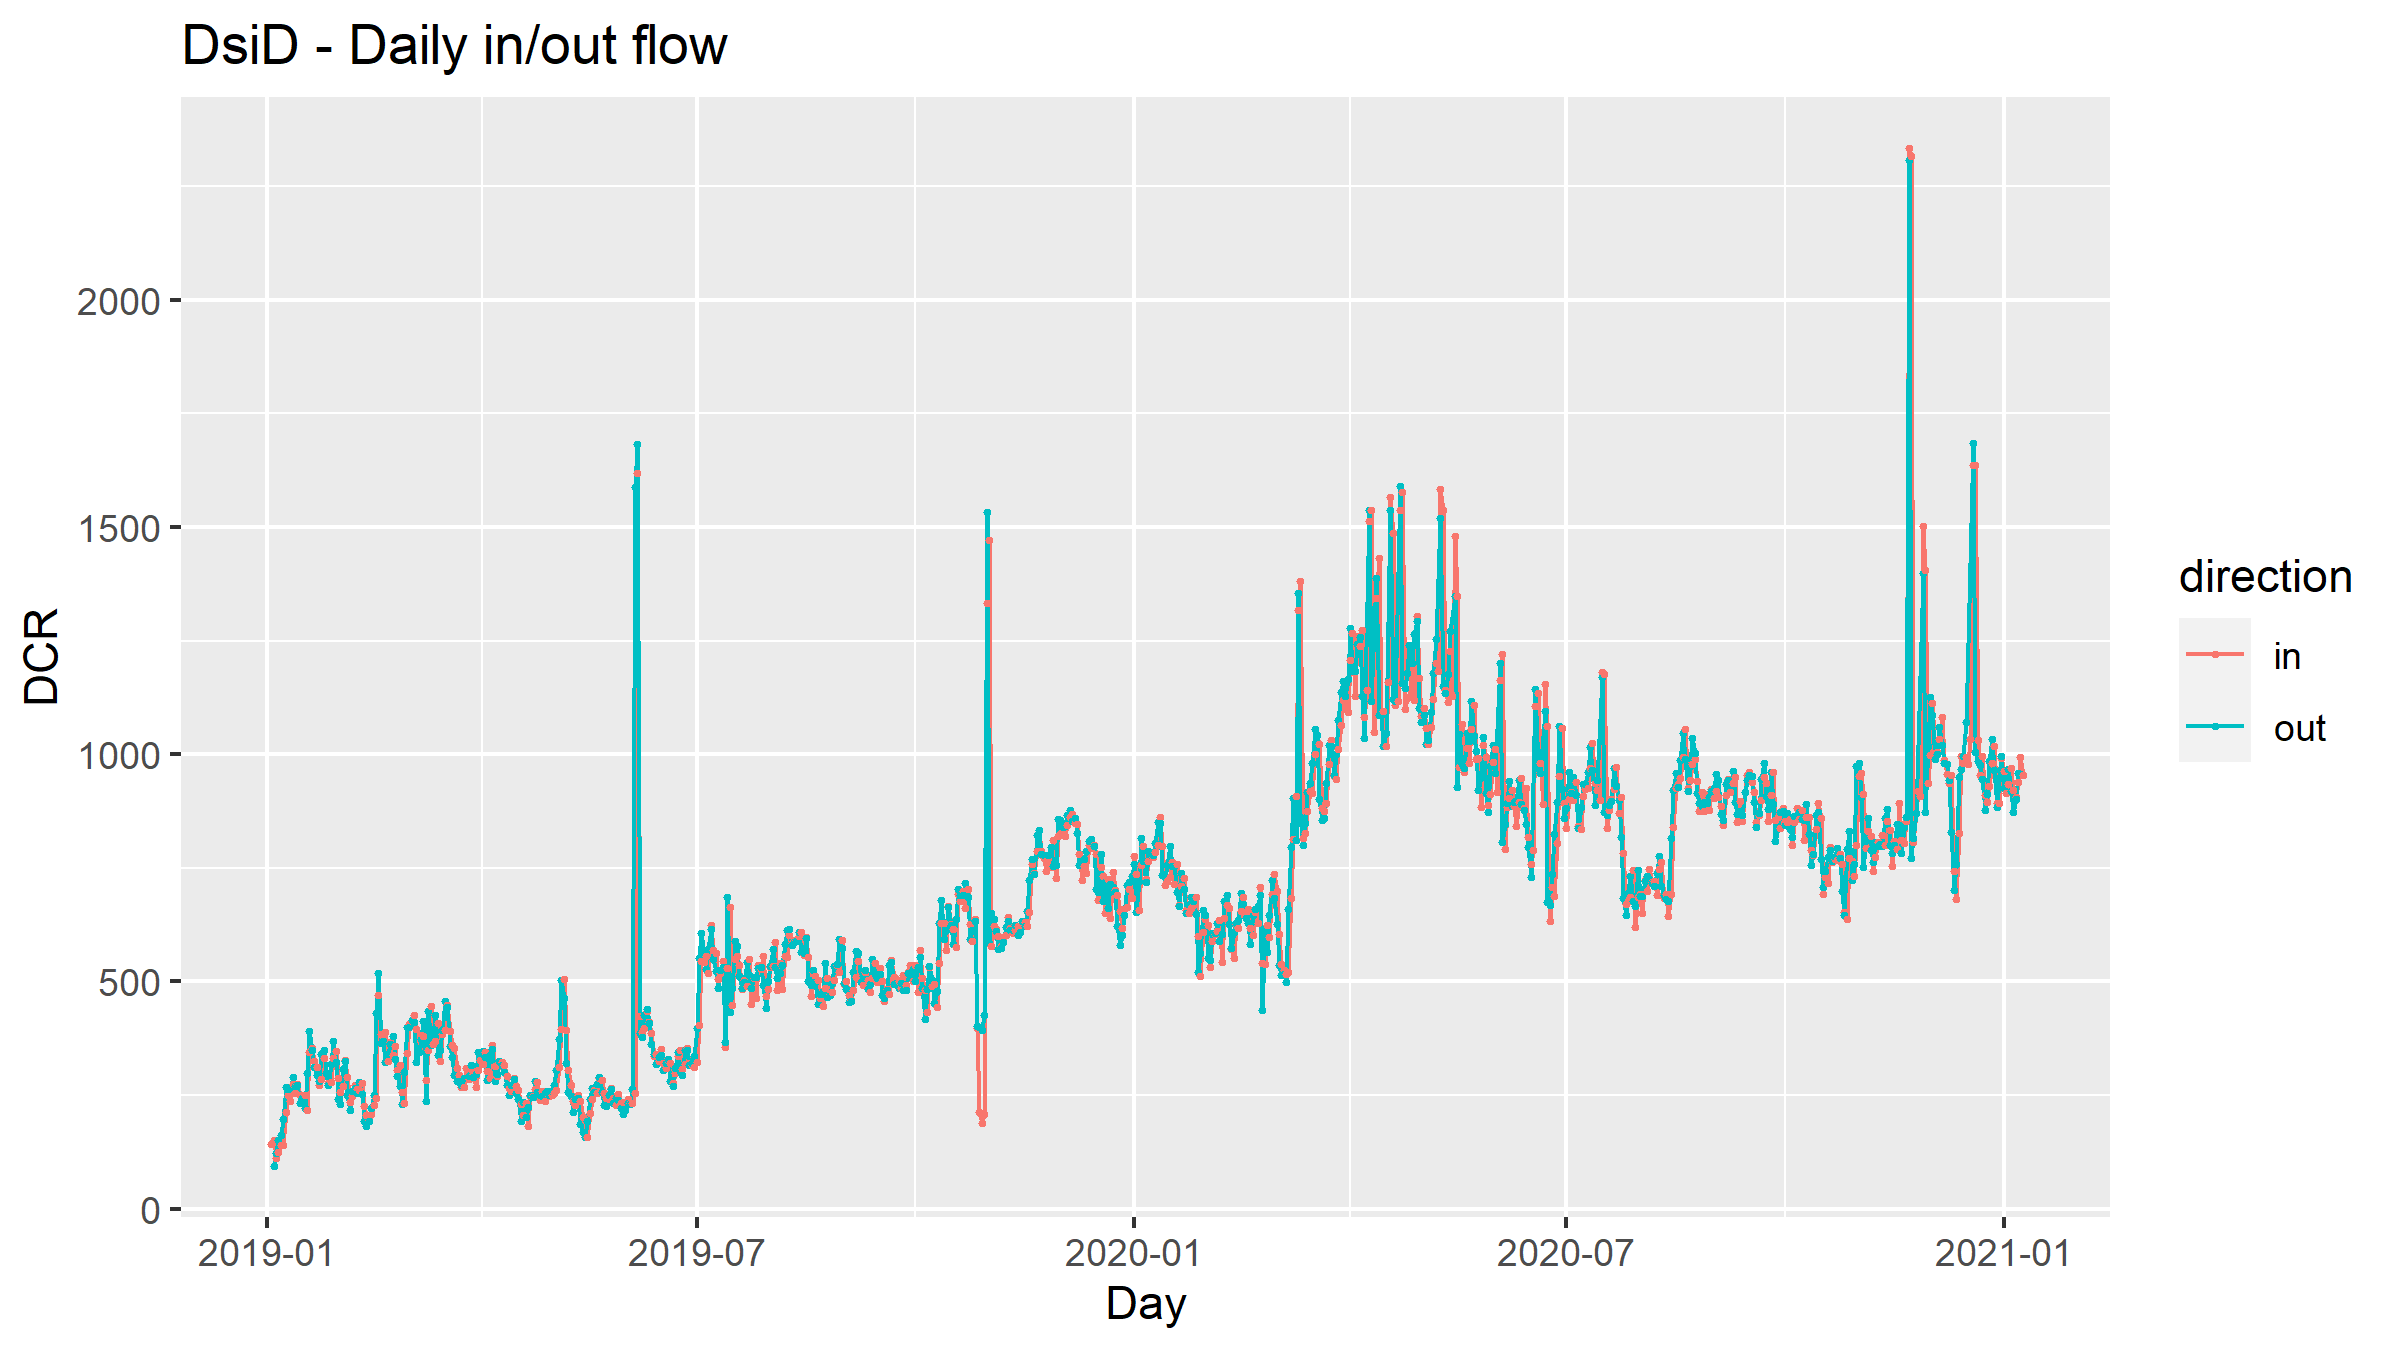
DCR flowing to/from the DsiD cluster
The amount of DCR being mined and moving out of the cluster each day is similar, suggesting that this is indeed a mining pool, the largest currently operating on the DCR network.
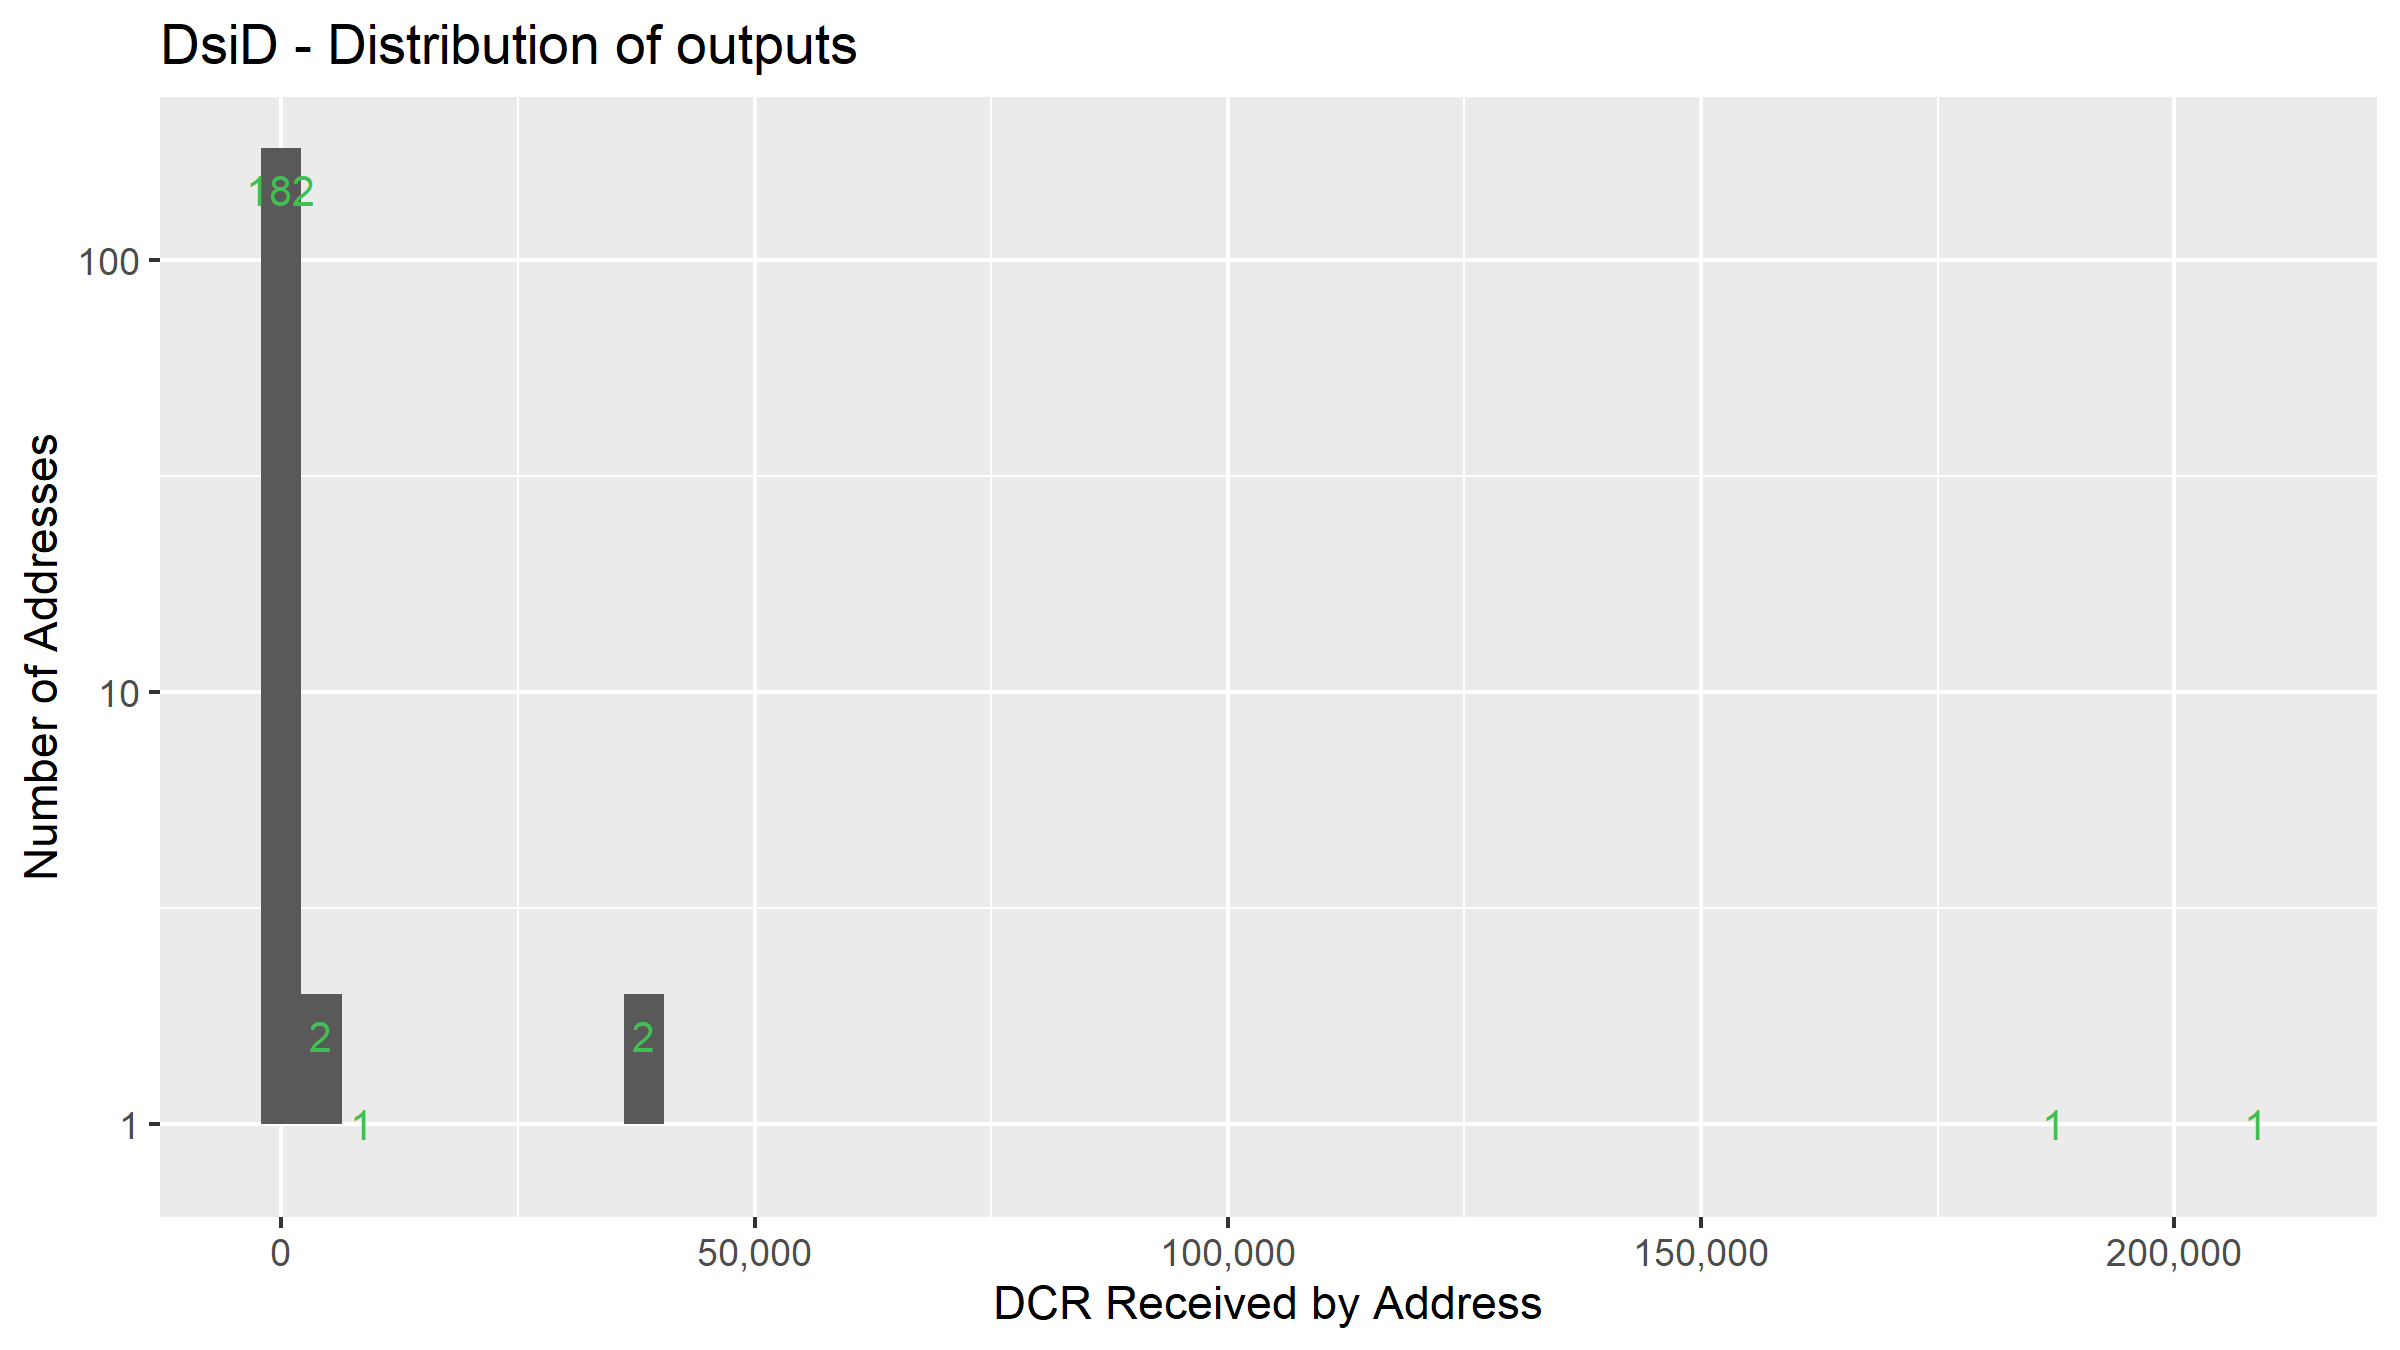
Distribution of DCR outputs between external addresses
We can also look at where that DCR flows to, and in this case there are two addresses which have both received around 200K DCR from the pool, with another two that have received 40-50K DCR. The largest recipient (DsgK) is featured below at number 3 in the top 5 pool miners list.

Network visualization for DsiD cluster
2 - Dsnx
This cluster started up in July 2019 and it’s still active, it has received 695K DCR in mining rewards from mining 38,923 blocks. This cluster controls 19 addresses, a much lower number than the previously considered cluster, likely because this cluster serves a different purpose.
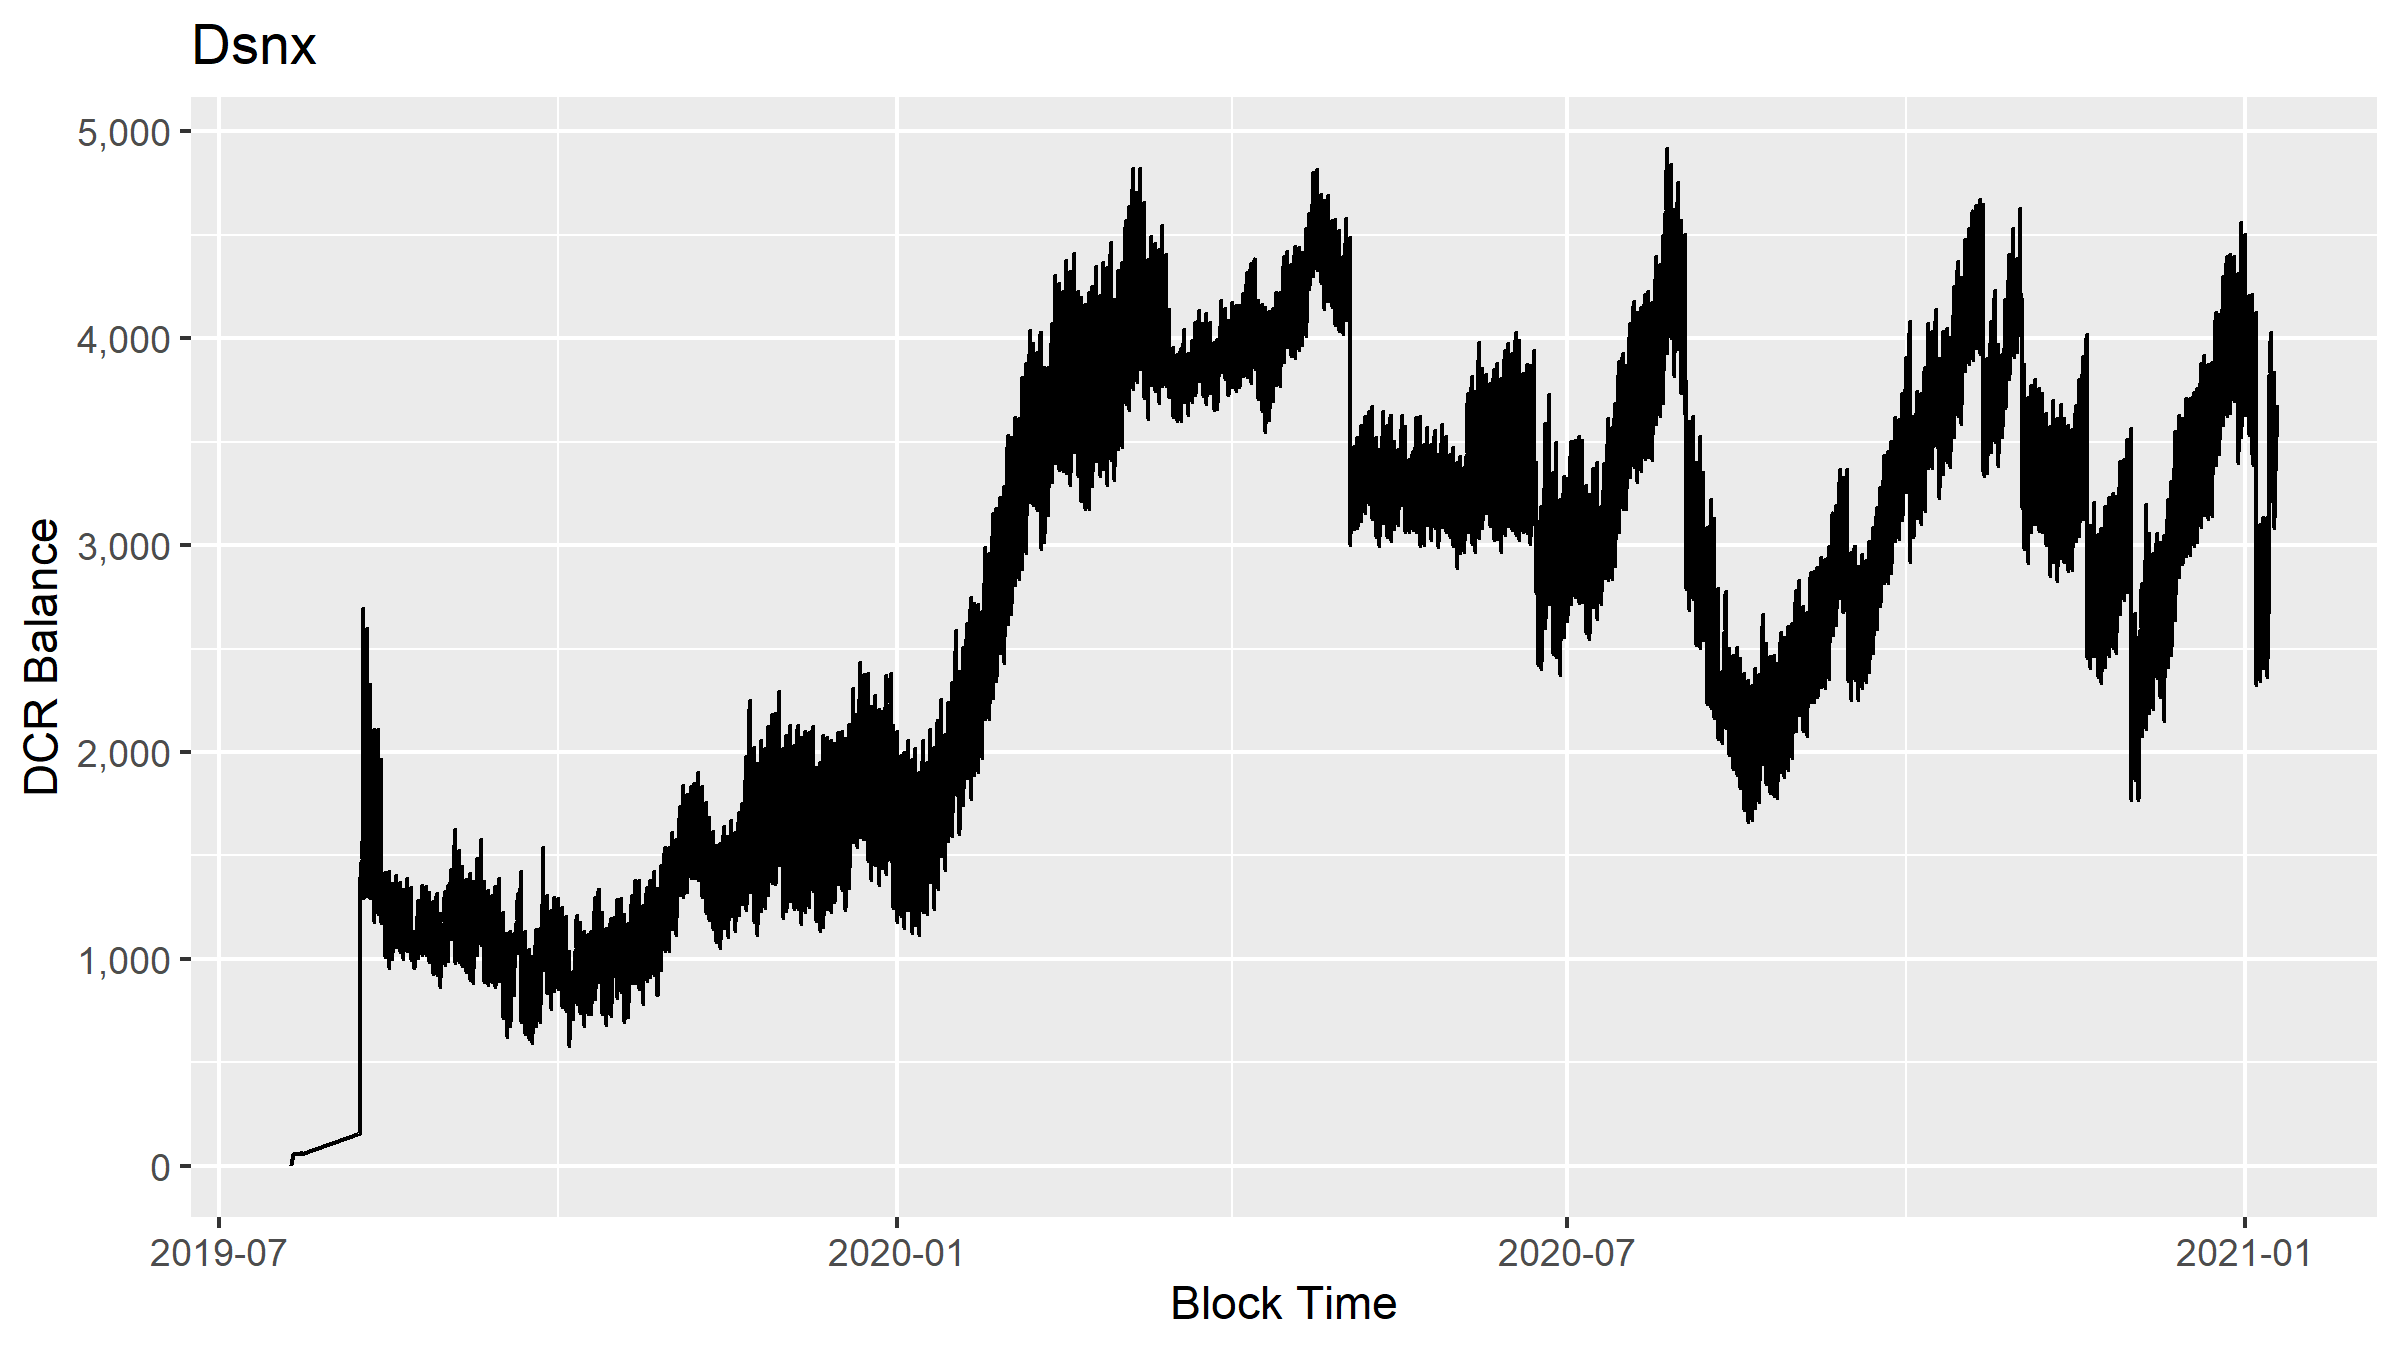
DCR balance of the Dsnx cluster
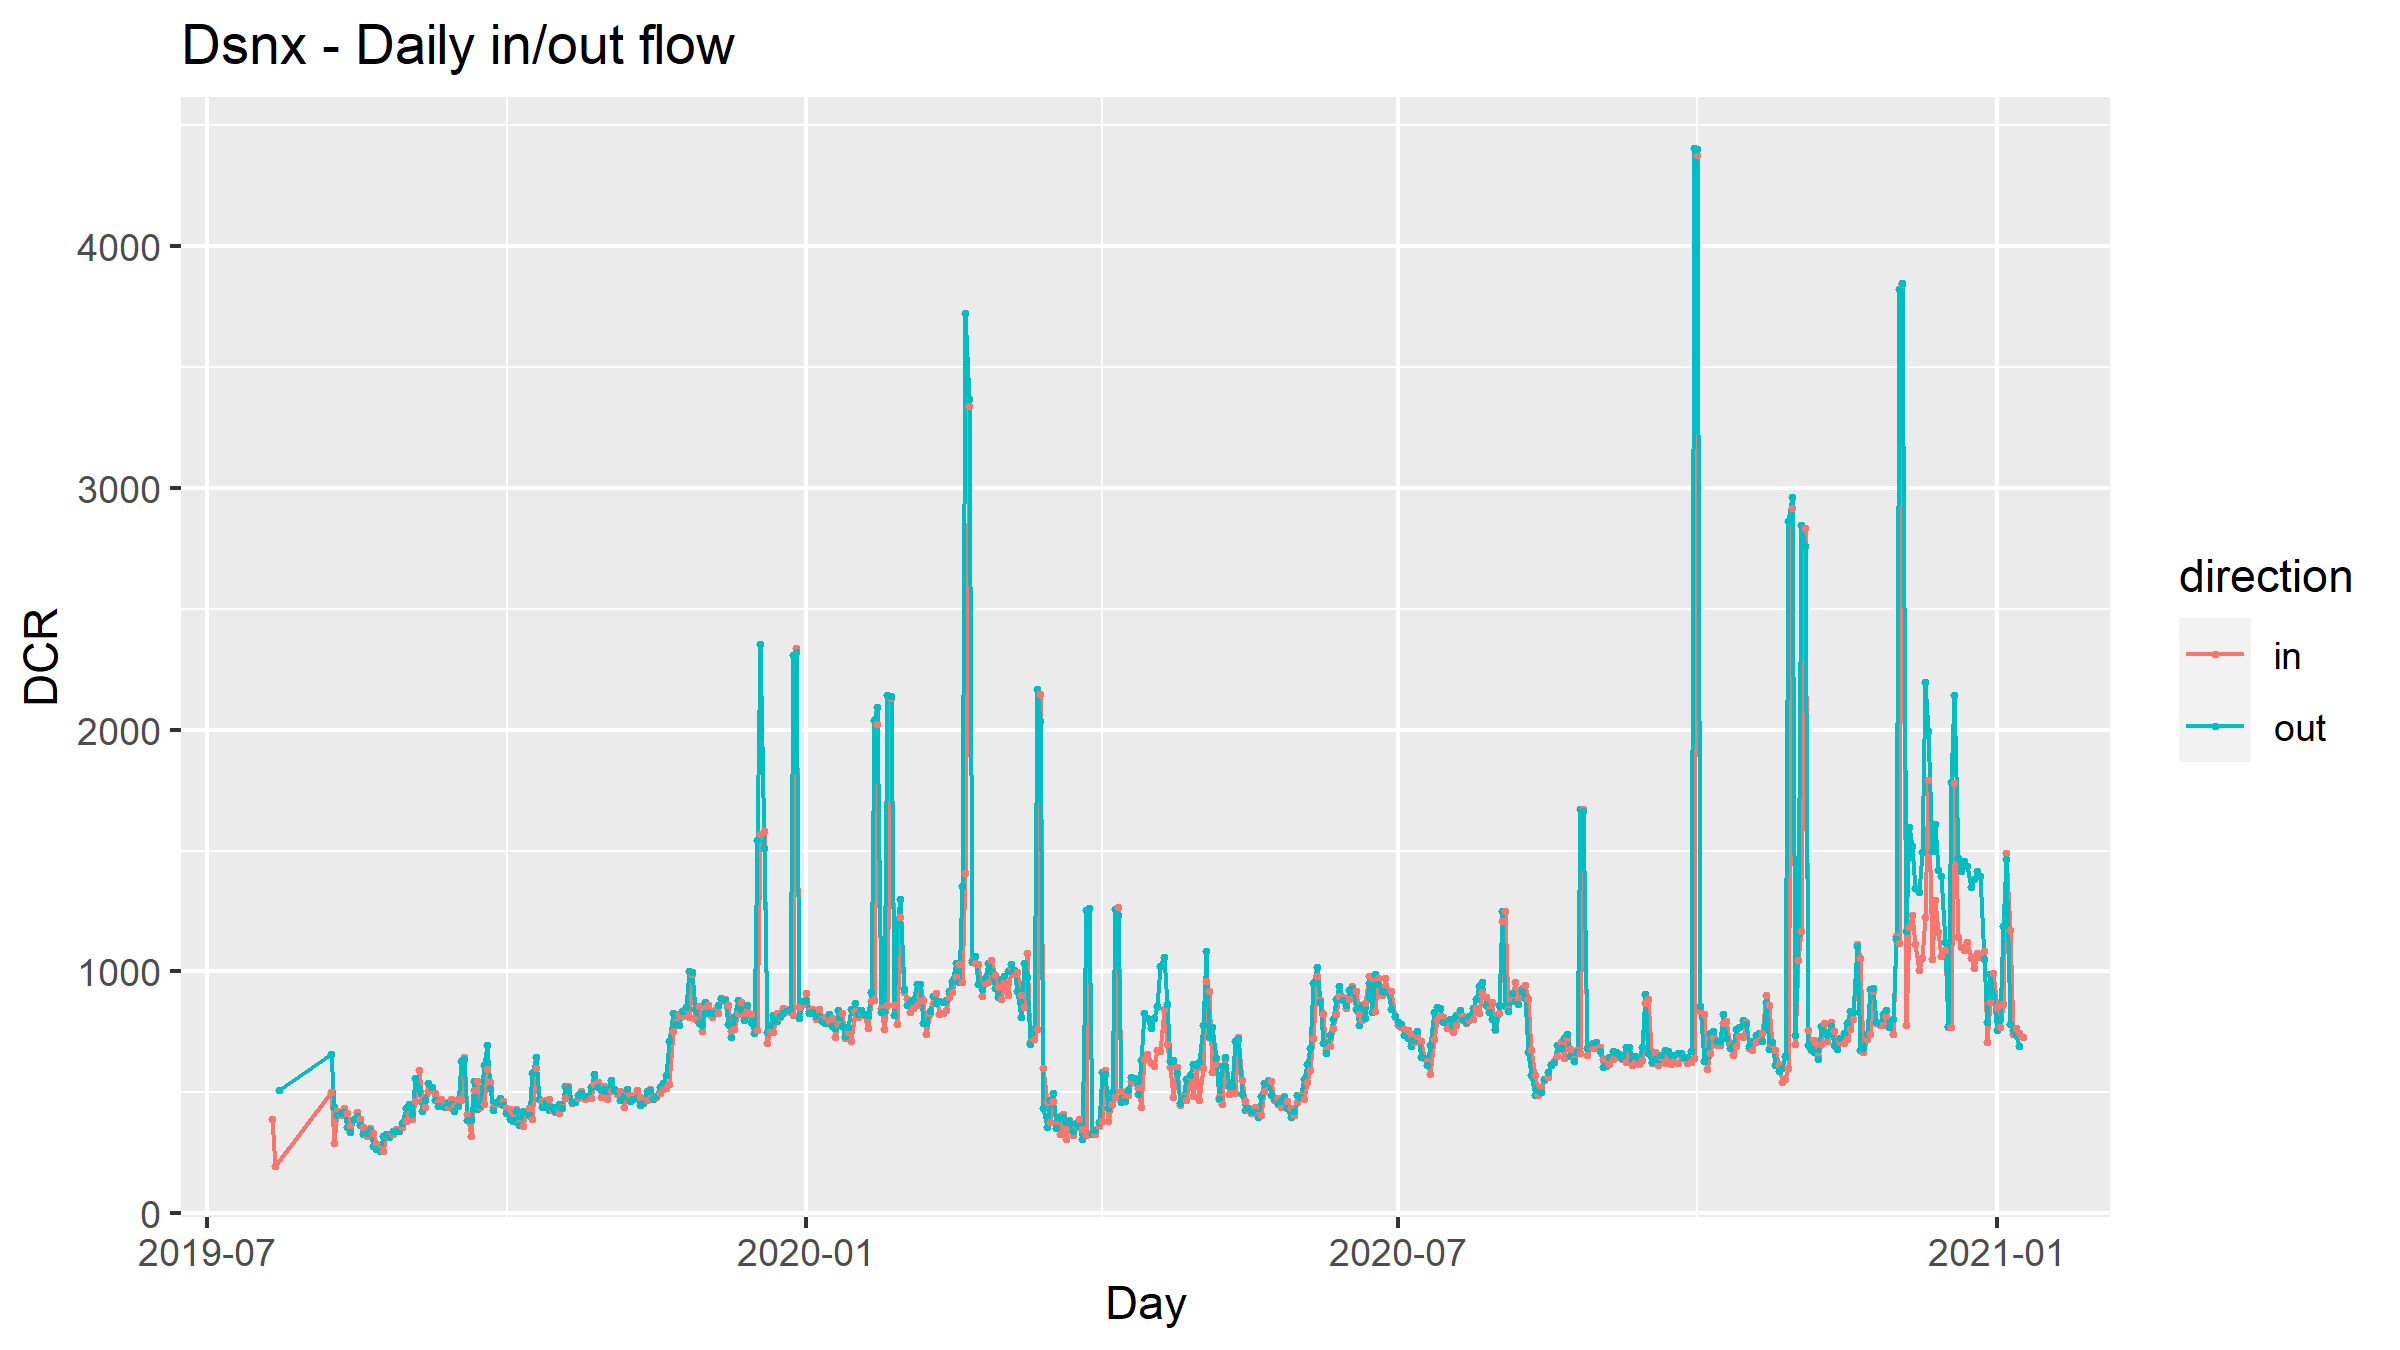
DCR flowing to/from the Dsnx cluster
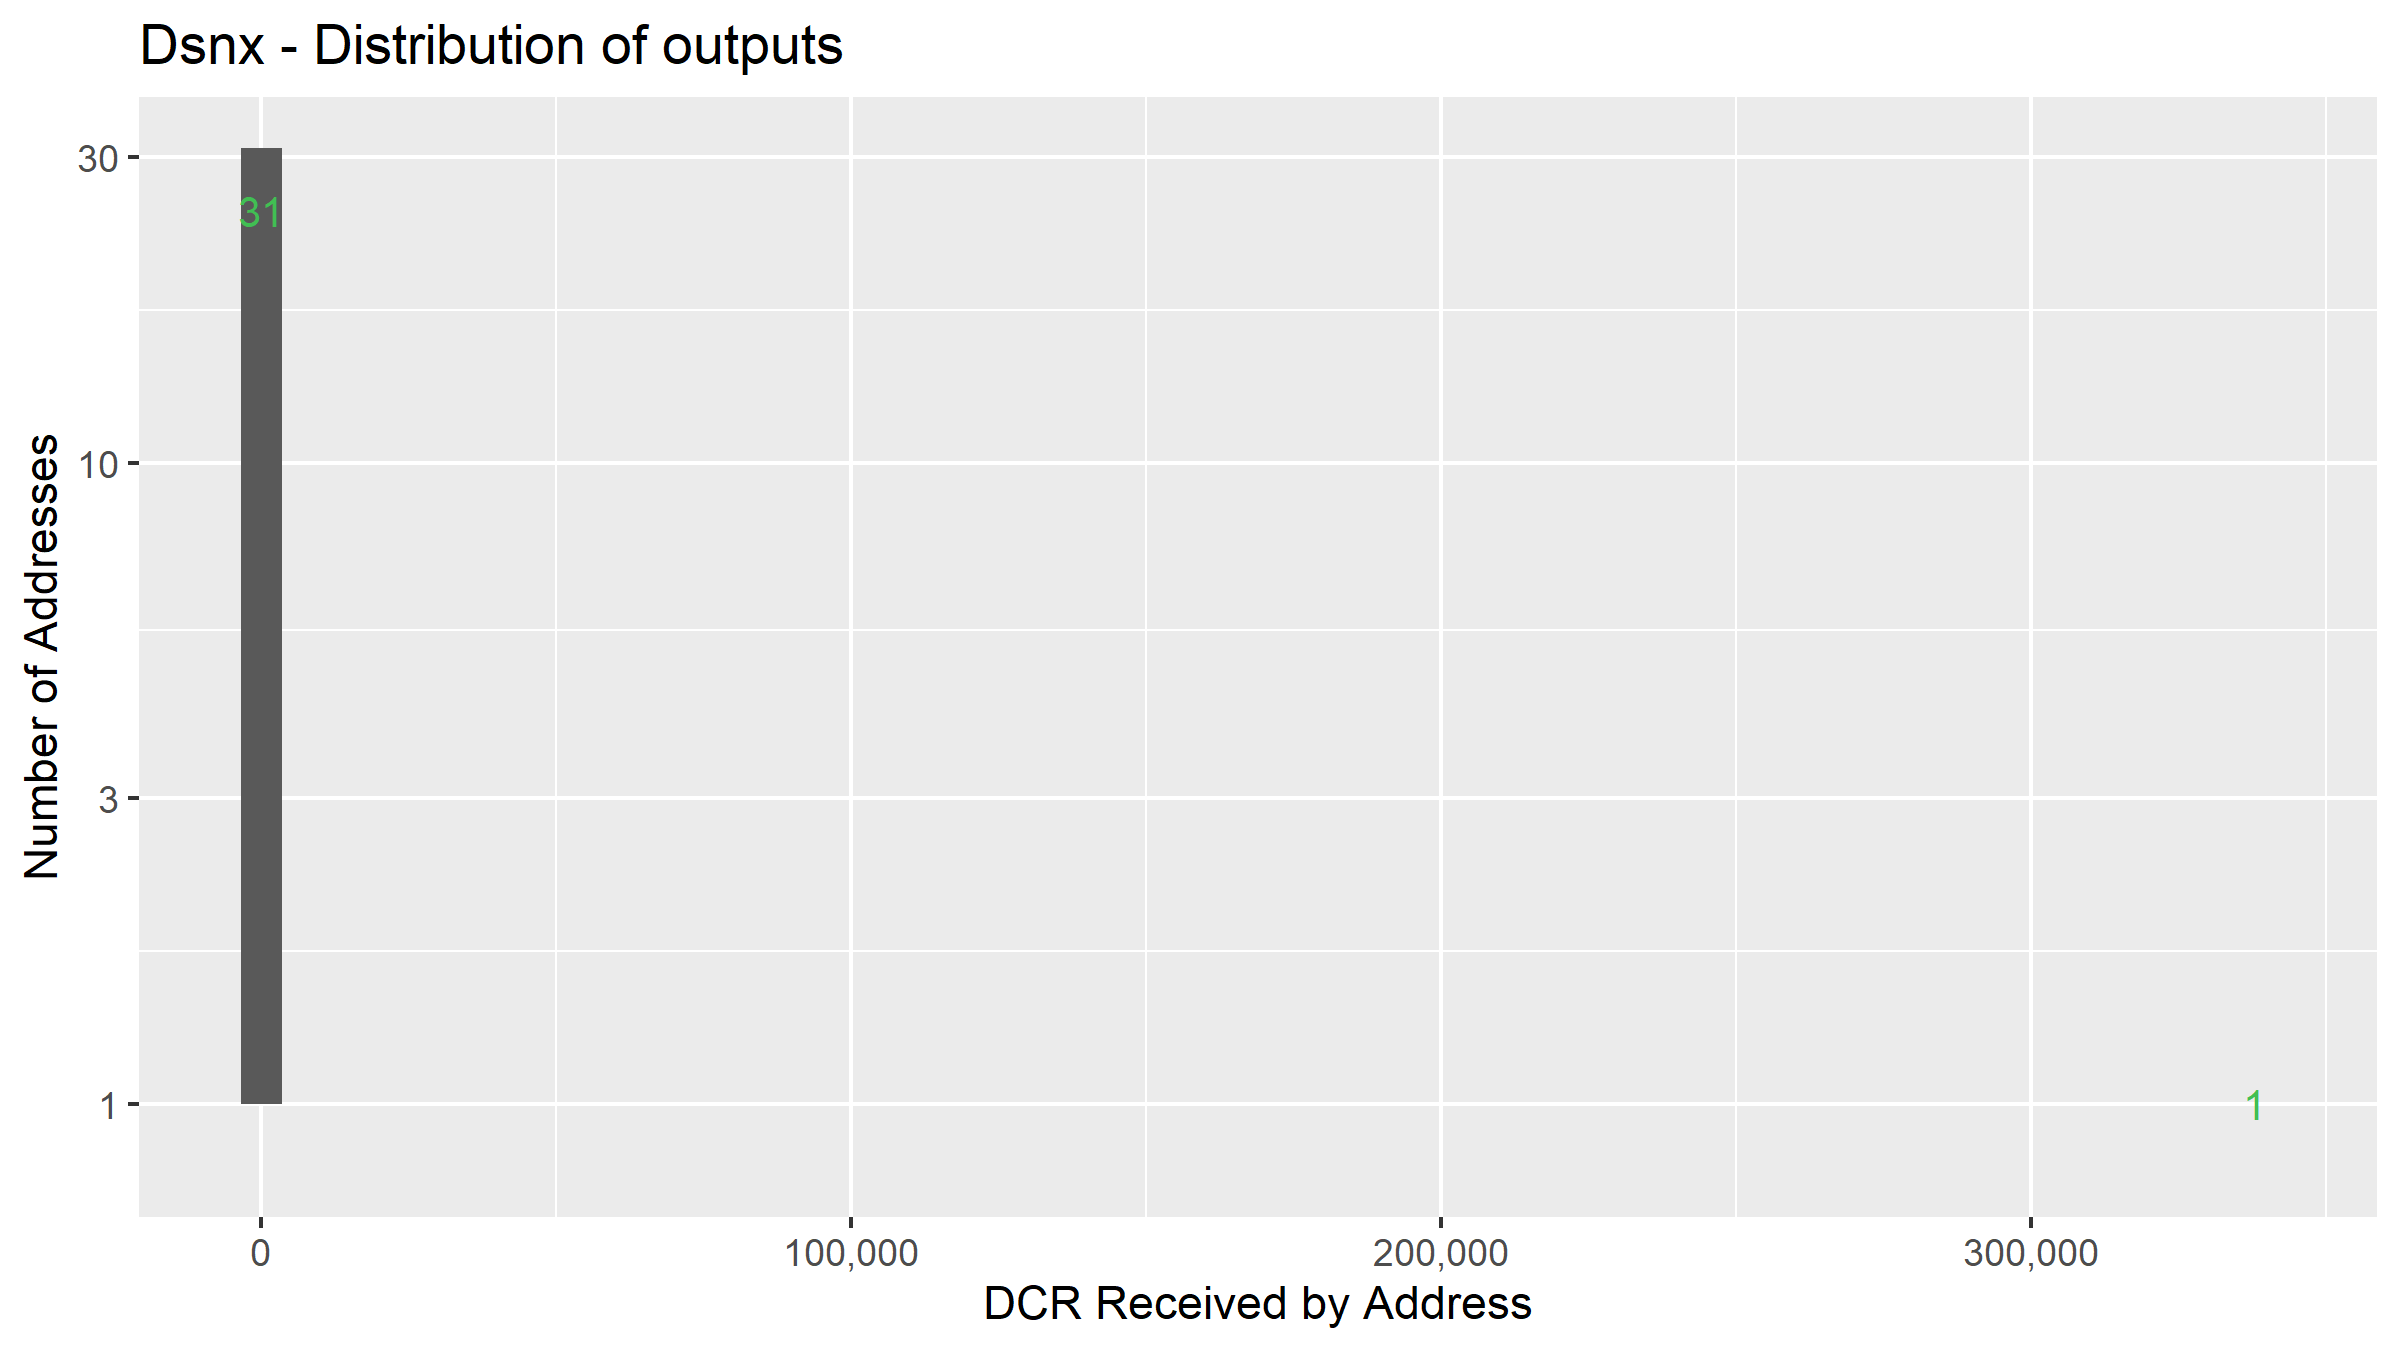
Distribution of DCR outputs between external addresses
The DCR is moving steadily through what looks like pool infrastructure, with payouts to 32 addresses but almost all of it (~97%) is going straight to one address (DsUb). The other addresses look like change addresses, so the purpose of this cluster is just to pass the mined DCR on to DsUb (considered below).
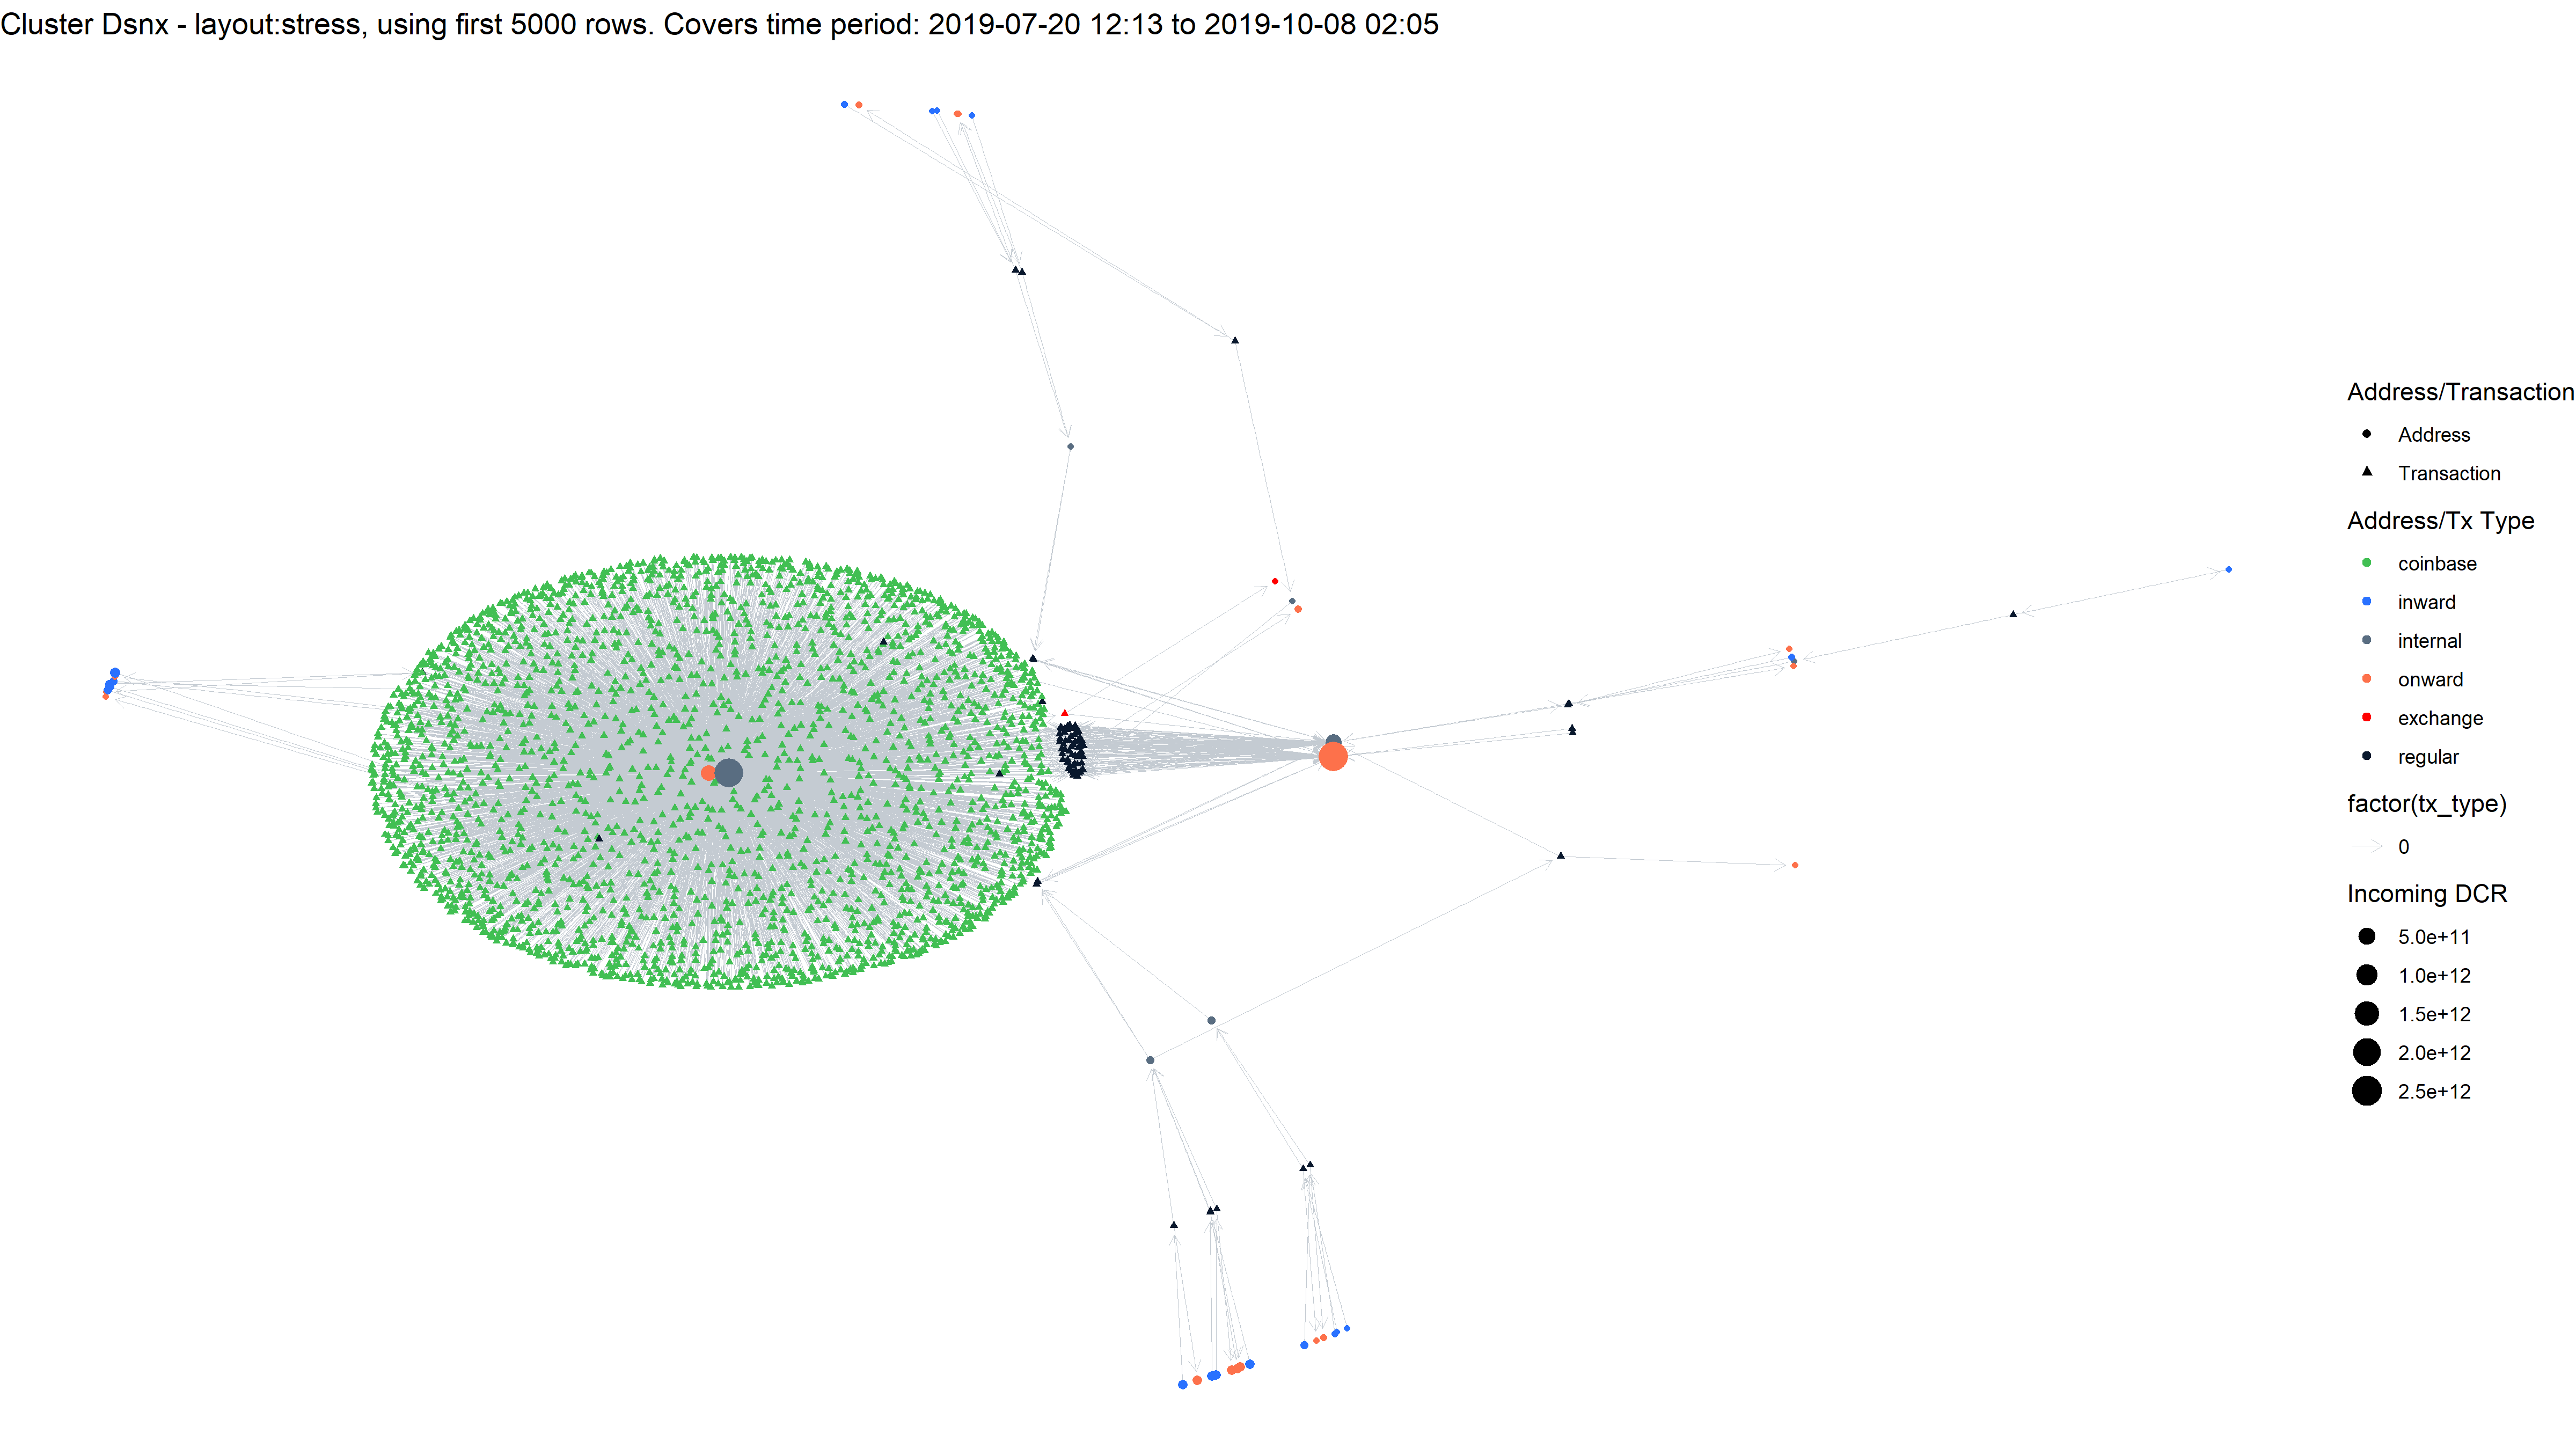
Network visualization for Dsnx cluster
3 - DsSW
The cluster around this address, which started mining in mid-2018, is quite different - because this miner stakes some DCR. More specifically, this miner mined 45,960 blocks and bought 622 tickets, starting in June 2019 and continuing to present.

DCR balance and voting of the DsSW cluster
I have built up a set of scripts which collect voting data for any tickets associated with a cluster. In this case the second pane is not interesting because the stakeholder did not vote on Politeia proposals, and the third one shows that they didn’t set their wallet to vote on any of the DCP agenda proposals to deploy consensus rules changing upgrades to the network.
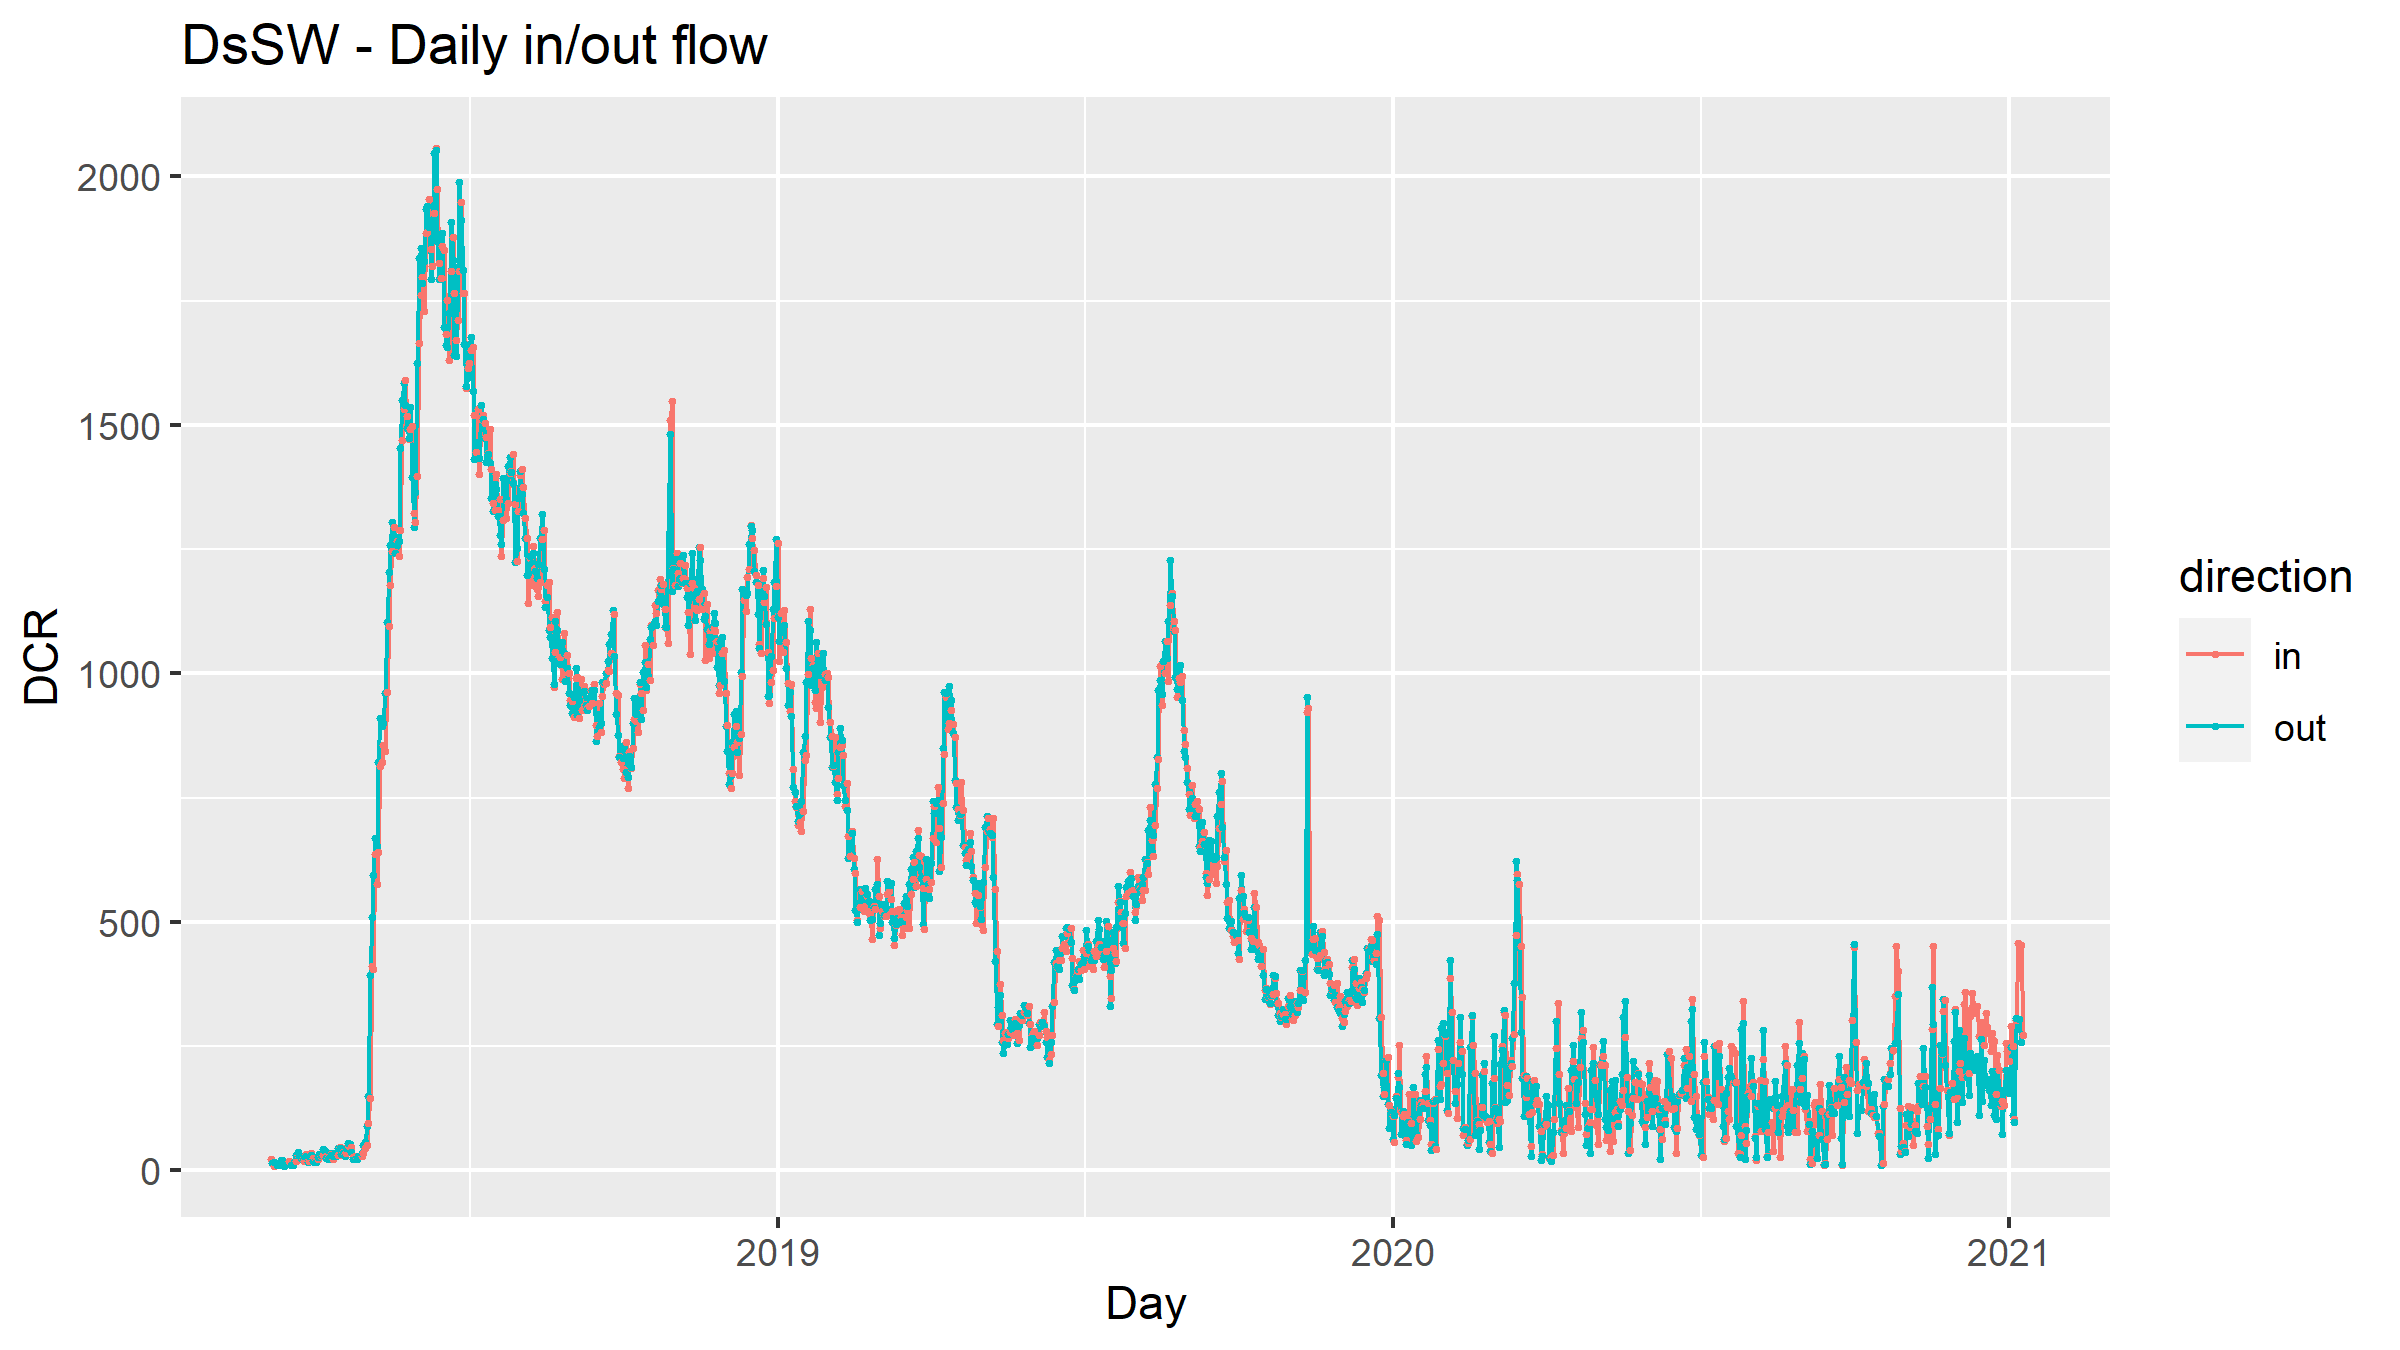
DCR flowing to/from the DsSW cluster
Putting this alongside the balance, it looks like the cluster has become a less important miner in 2020, but they continue to stake some DCR.
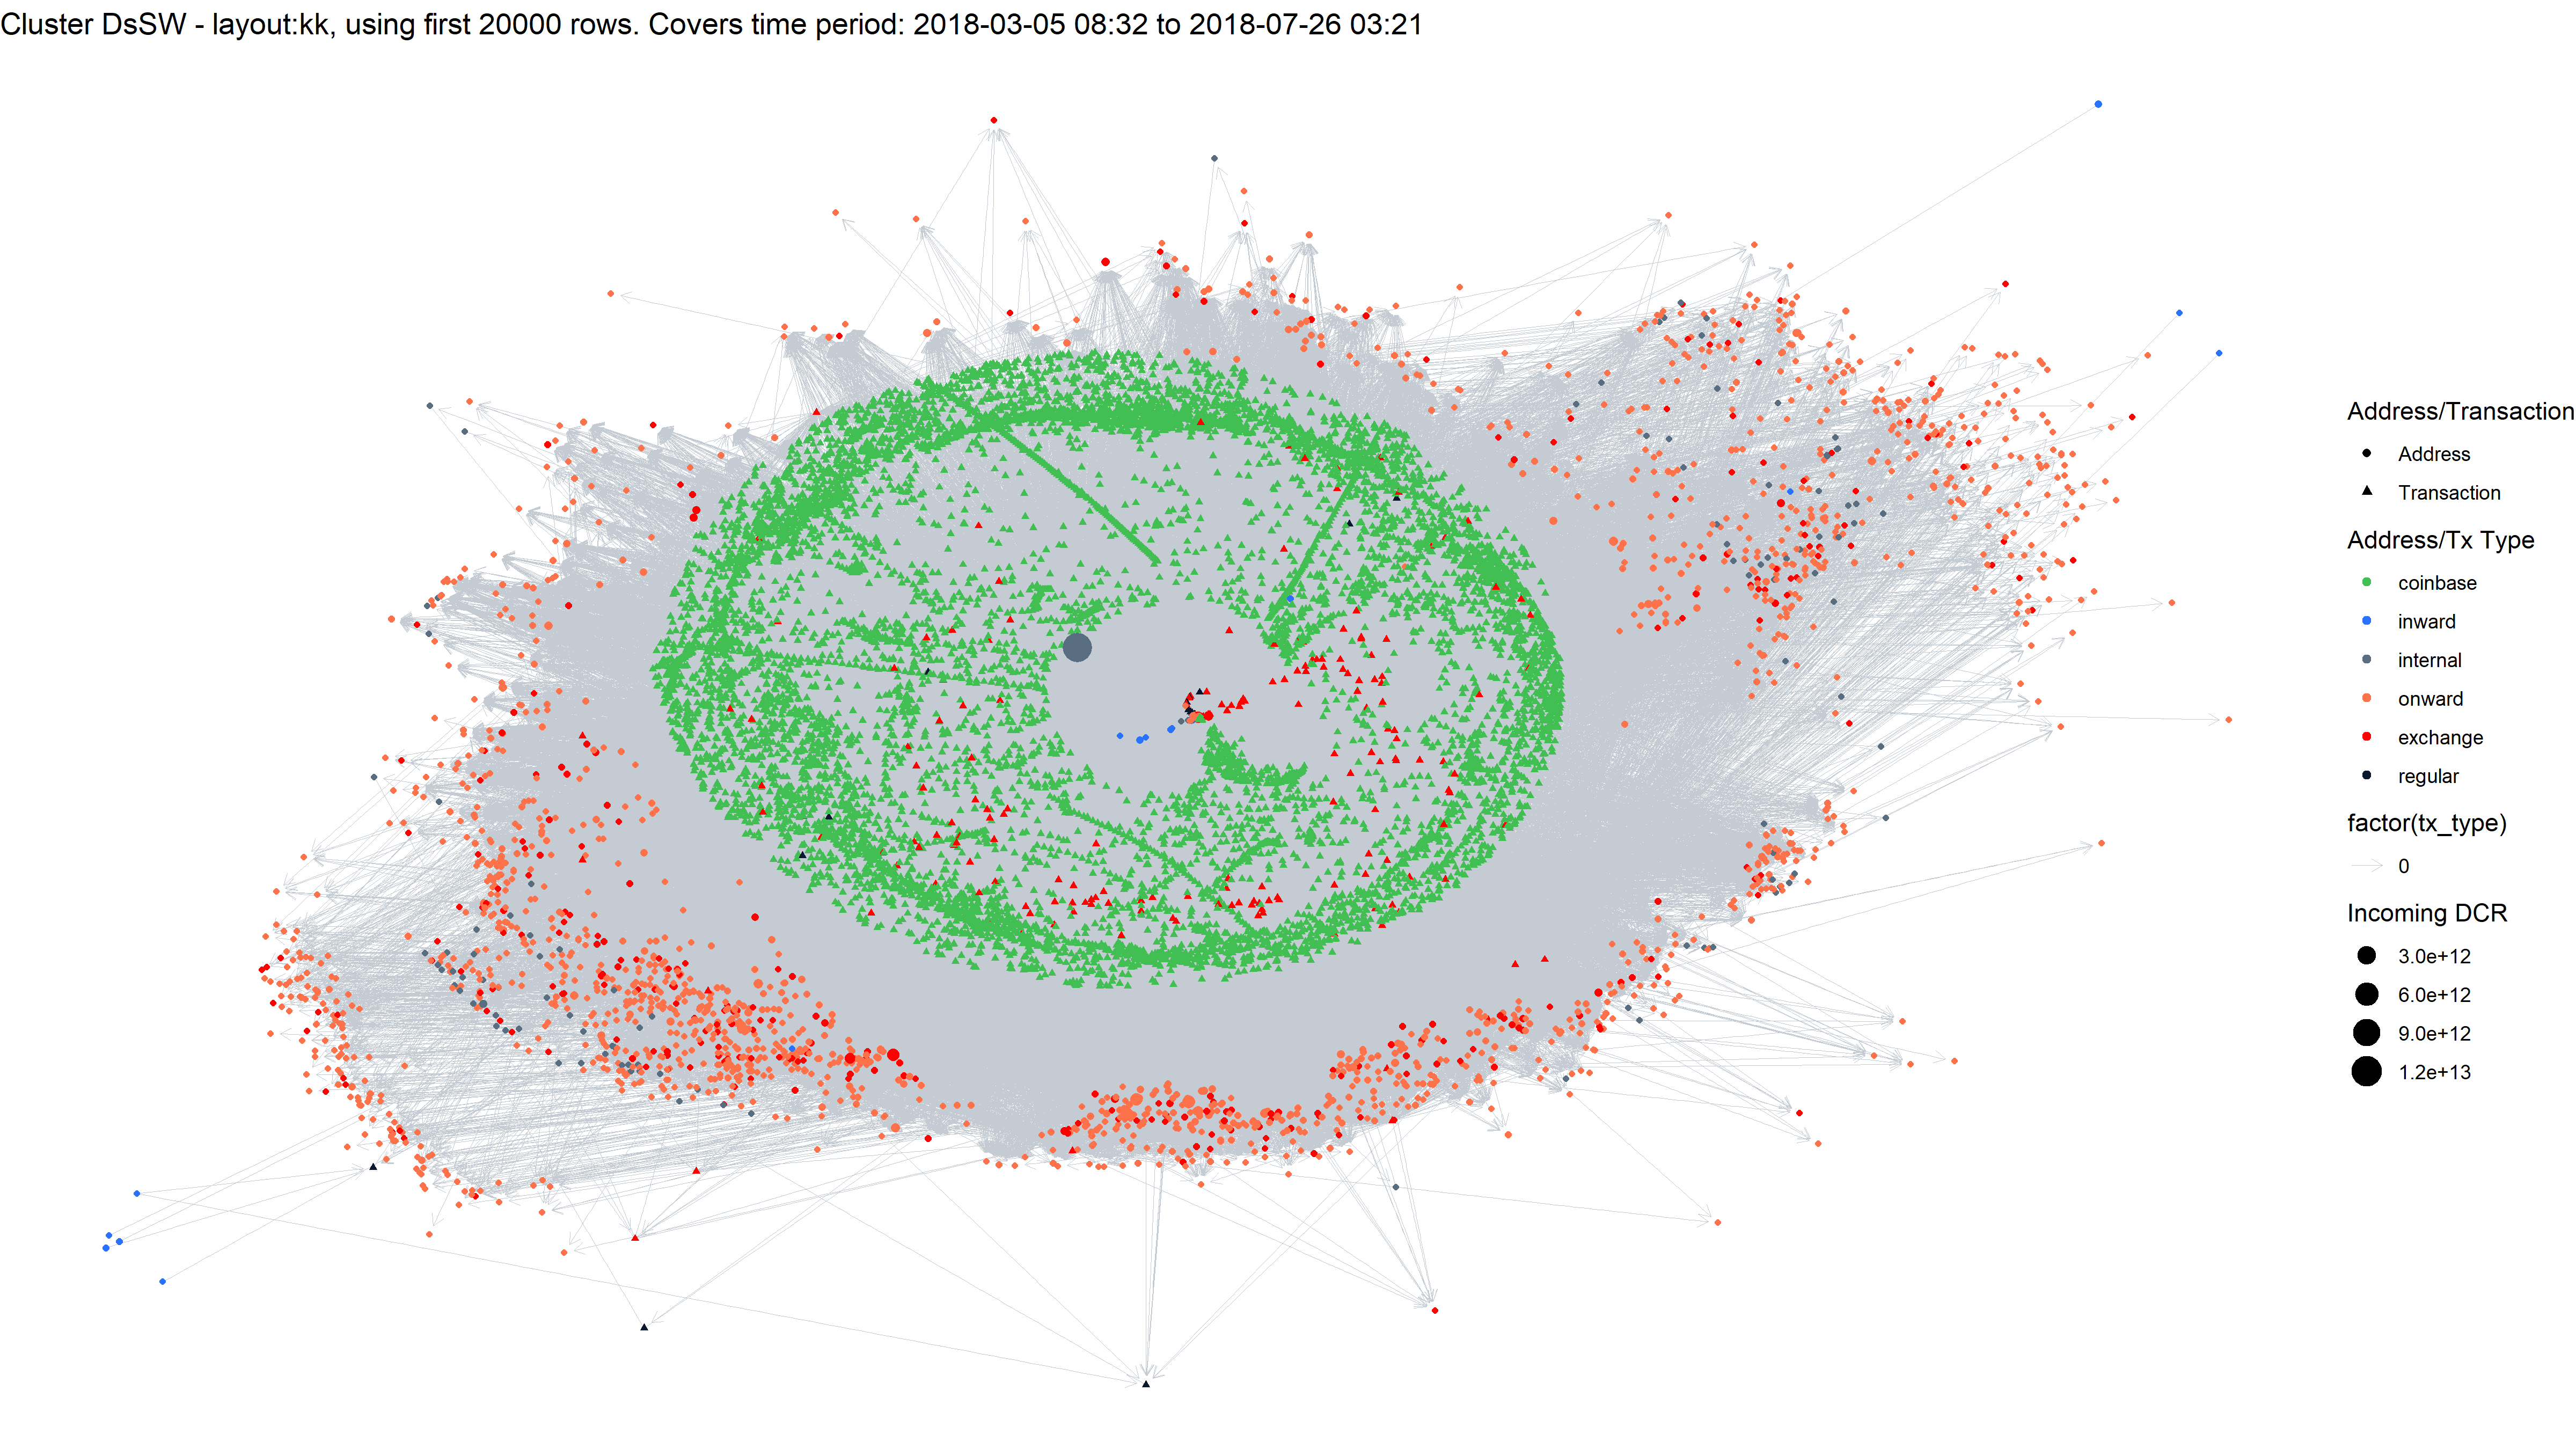
Network visualization for DsSW cluster
The period covered by this graph is before the cluster started staking, but see the end of the report for a graph that shows a cluster staking and voting.
This cluster has many outputs which are hitting known exchange addresses, and unlike the clusters above these sum to significant amounts of DCR (45K to Binance, 34K to Bittrex, 19K to Poloniex).
4 - Dsju
This cluster received 202K DCR in hop 0 mining rewards, starting in March 2019 and still going.
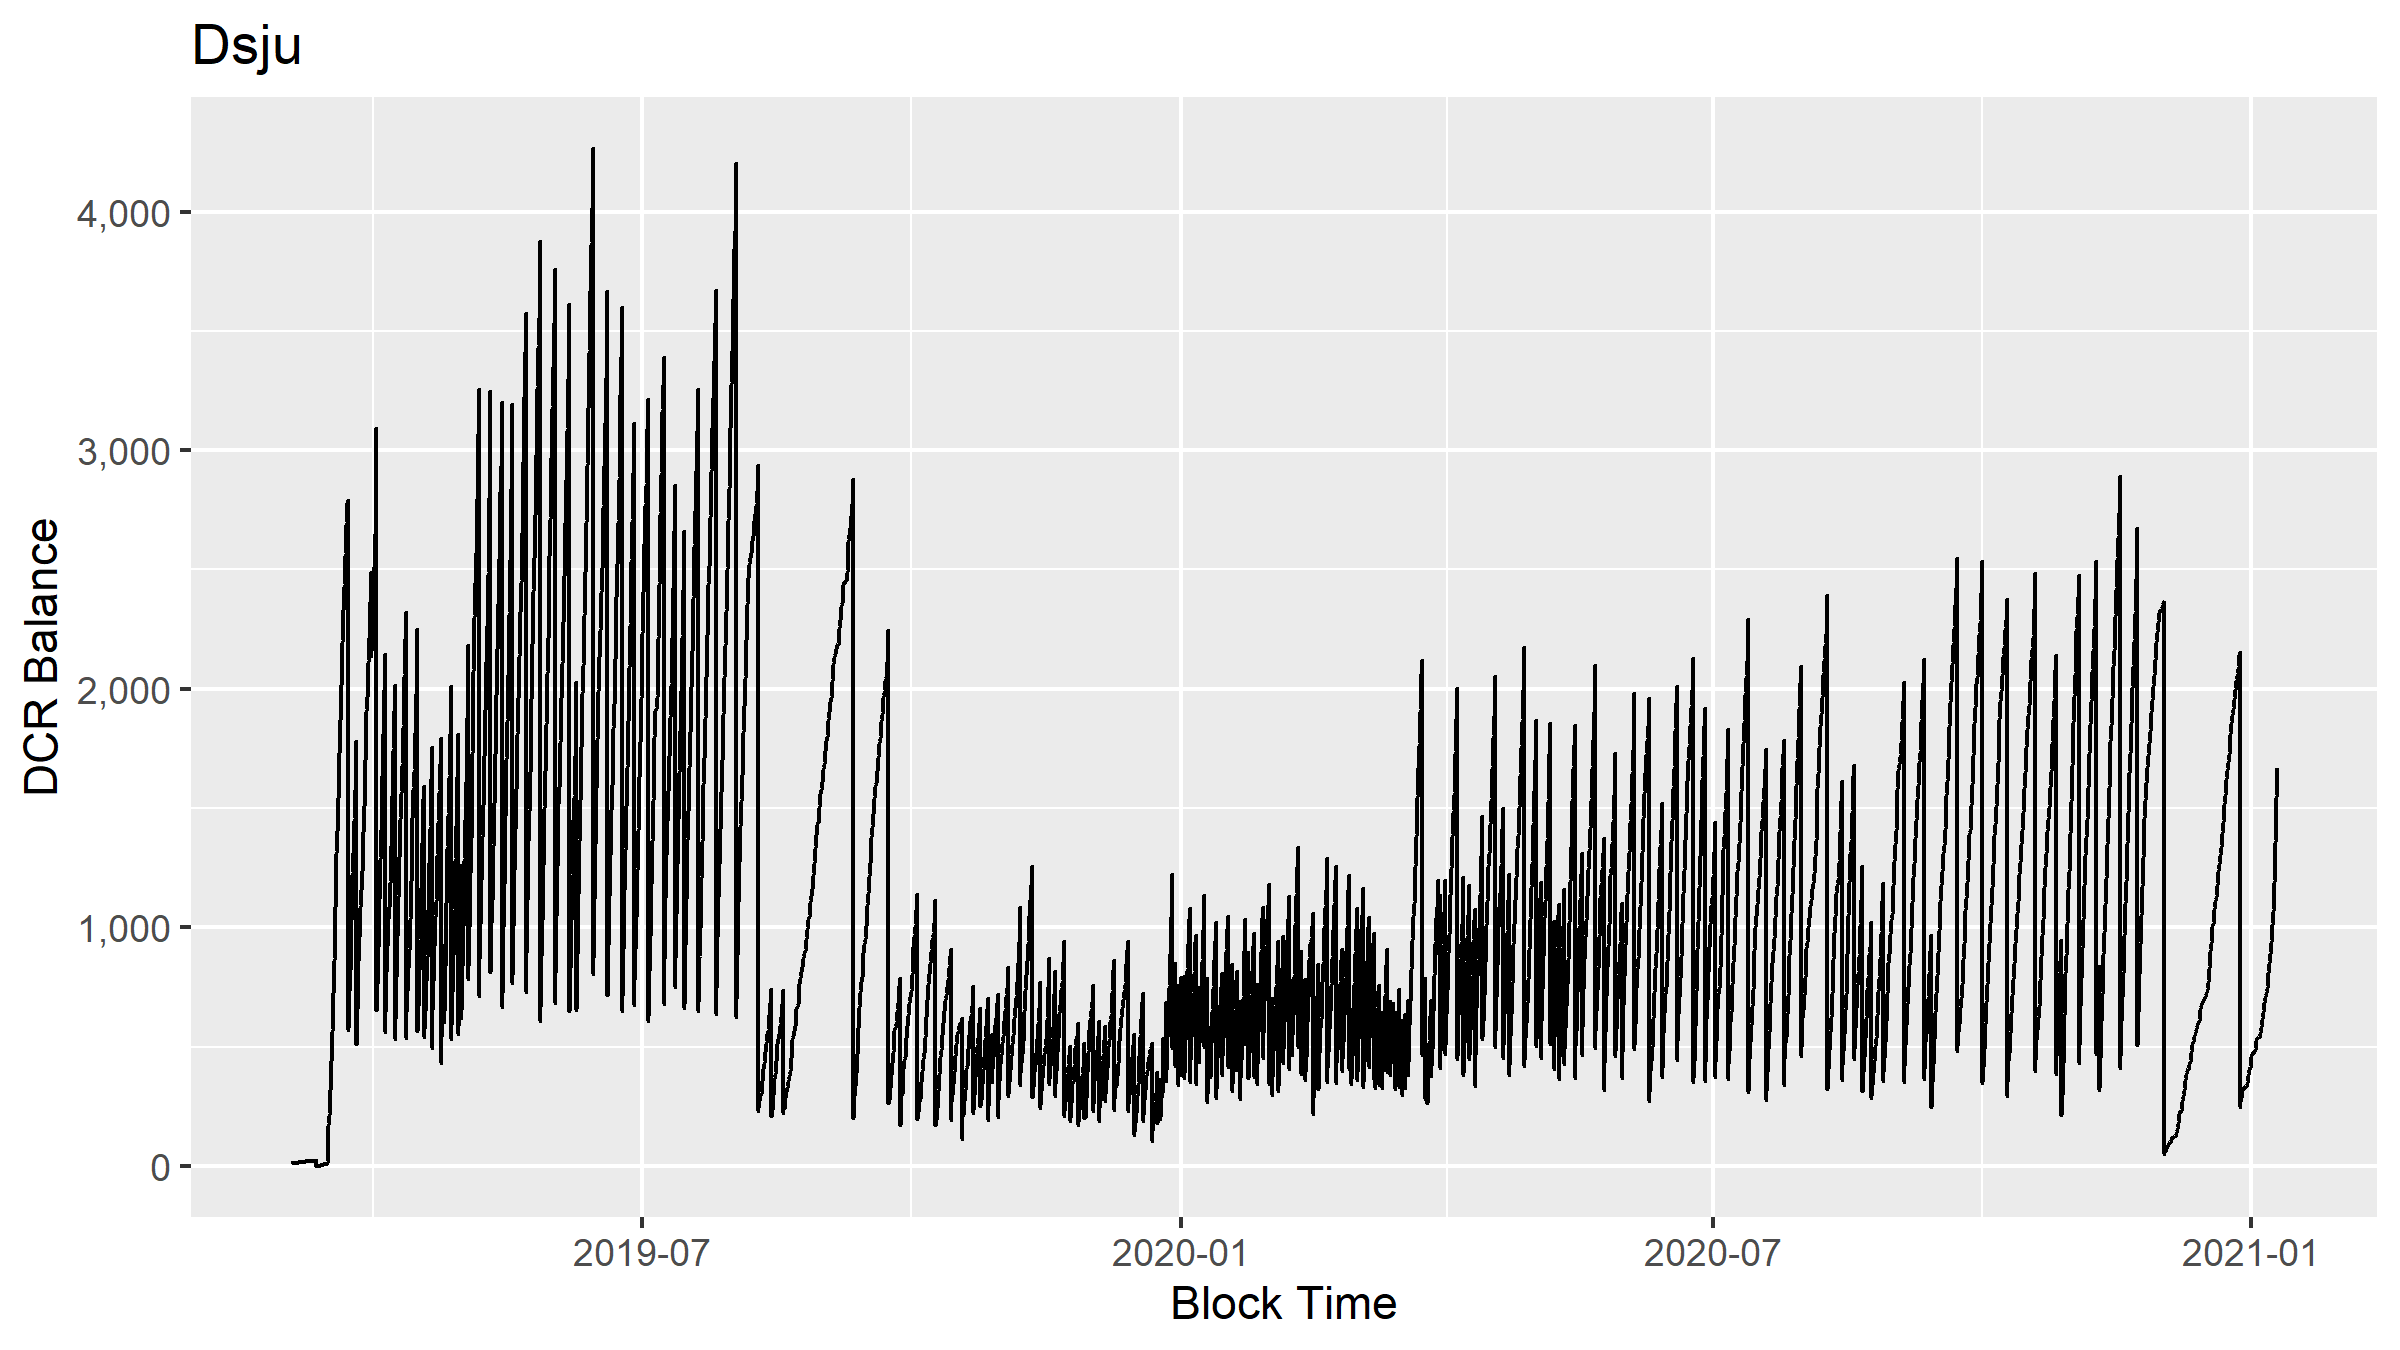
DCR balance of the Dsju cluster
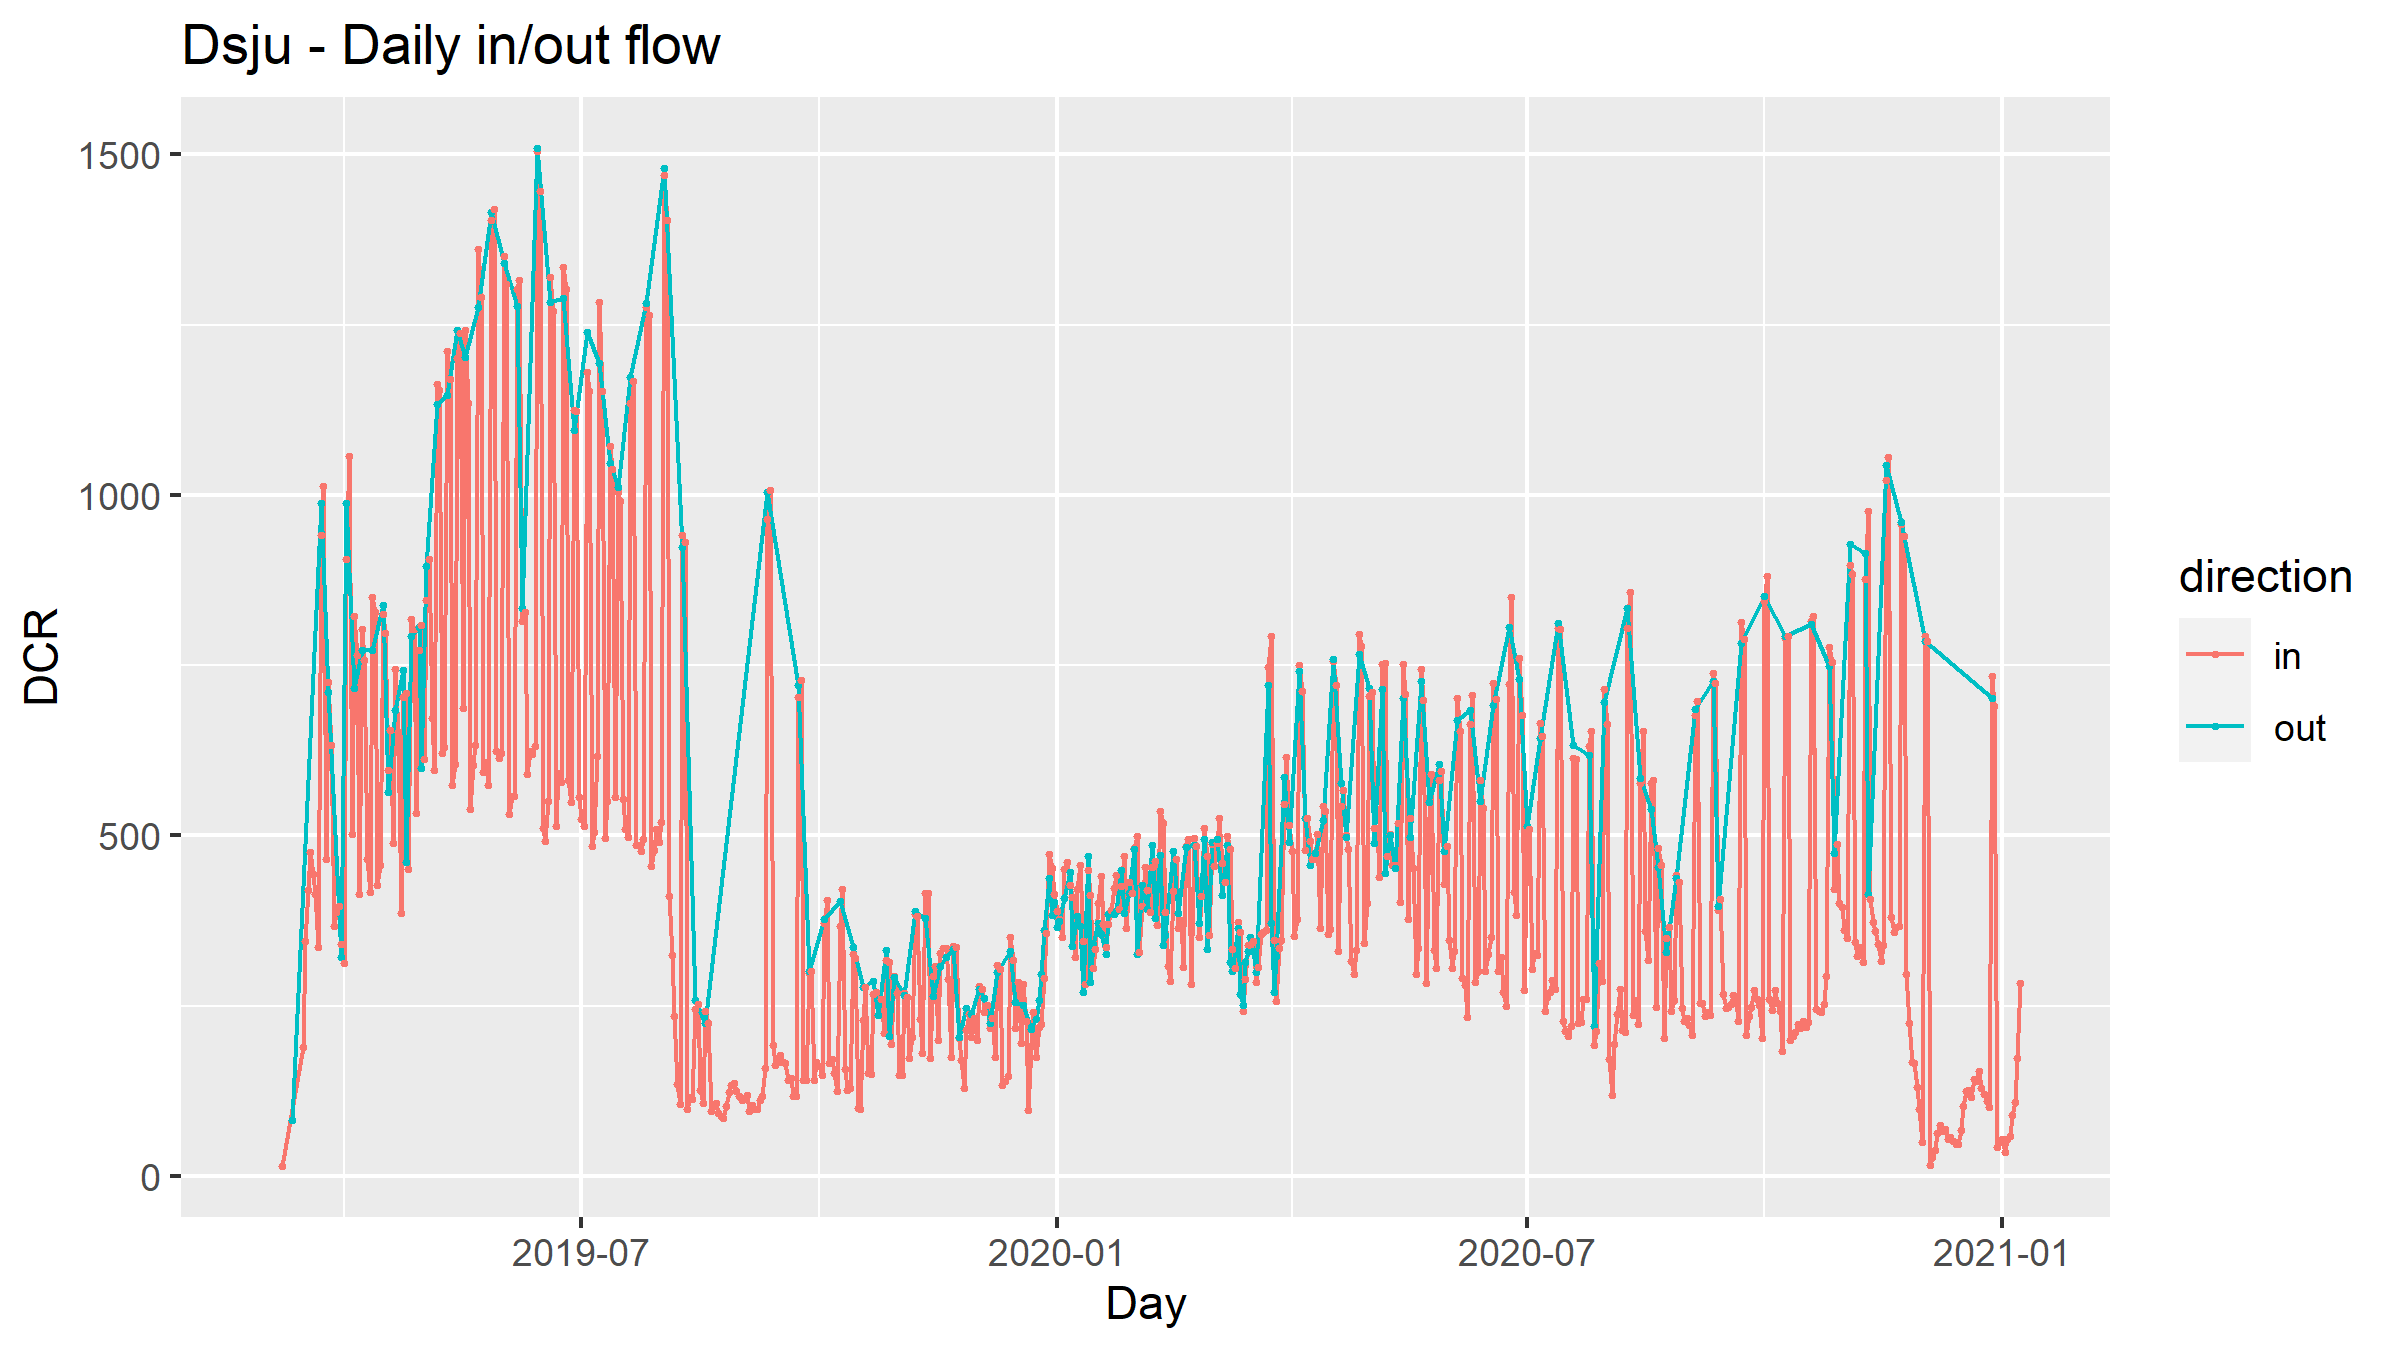
DCR flowing to/from the Dsju cluster
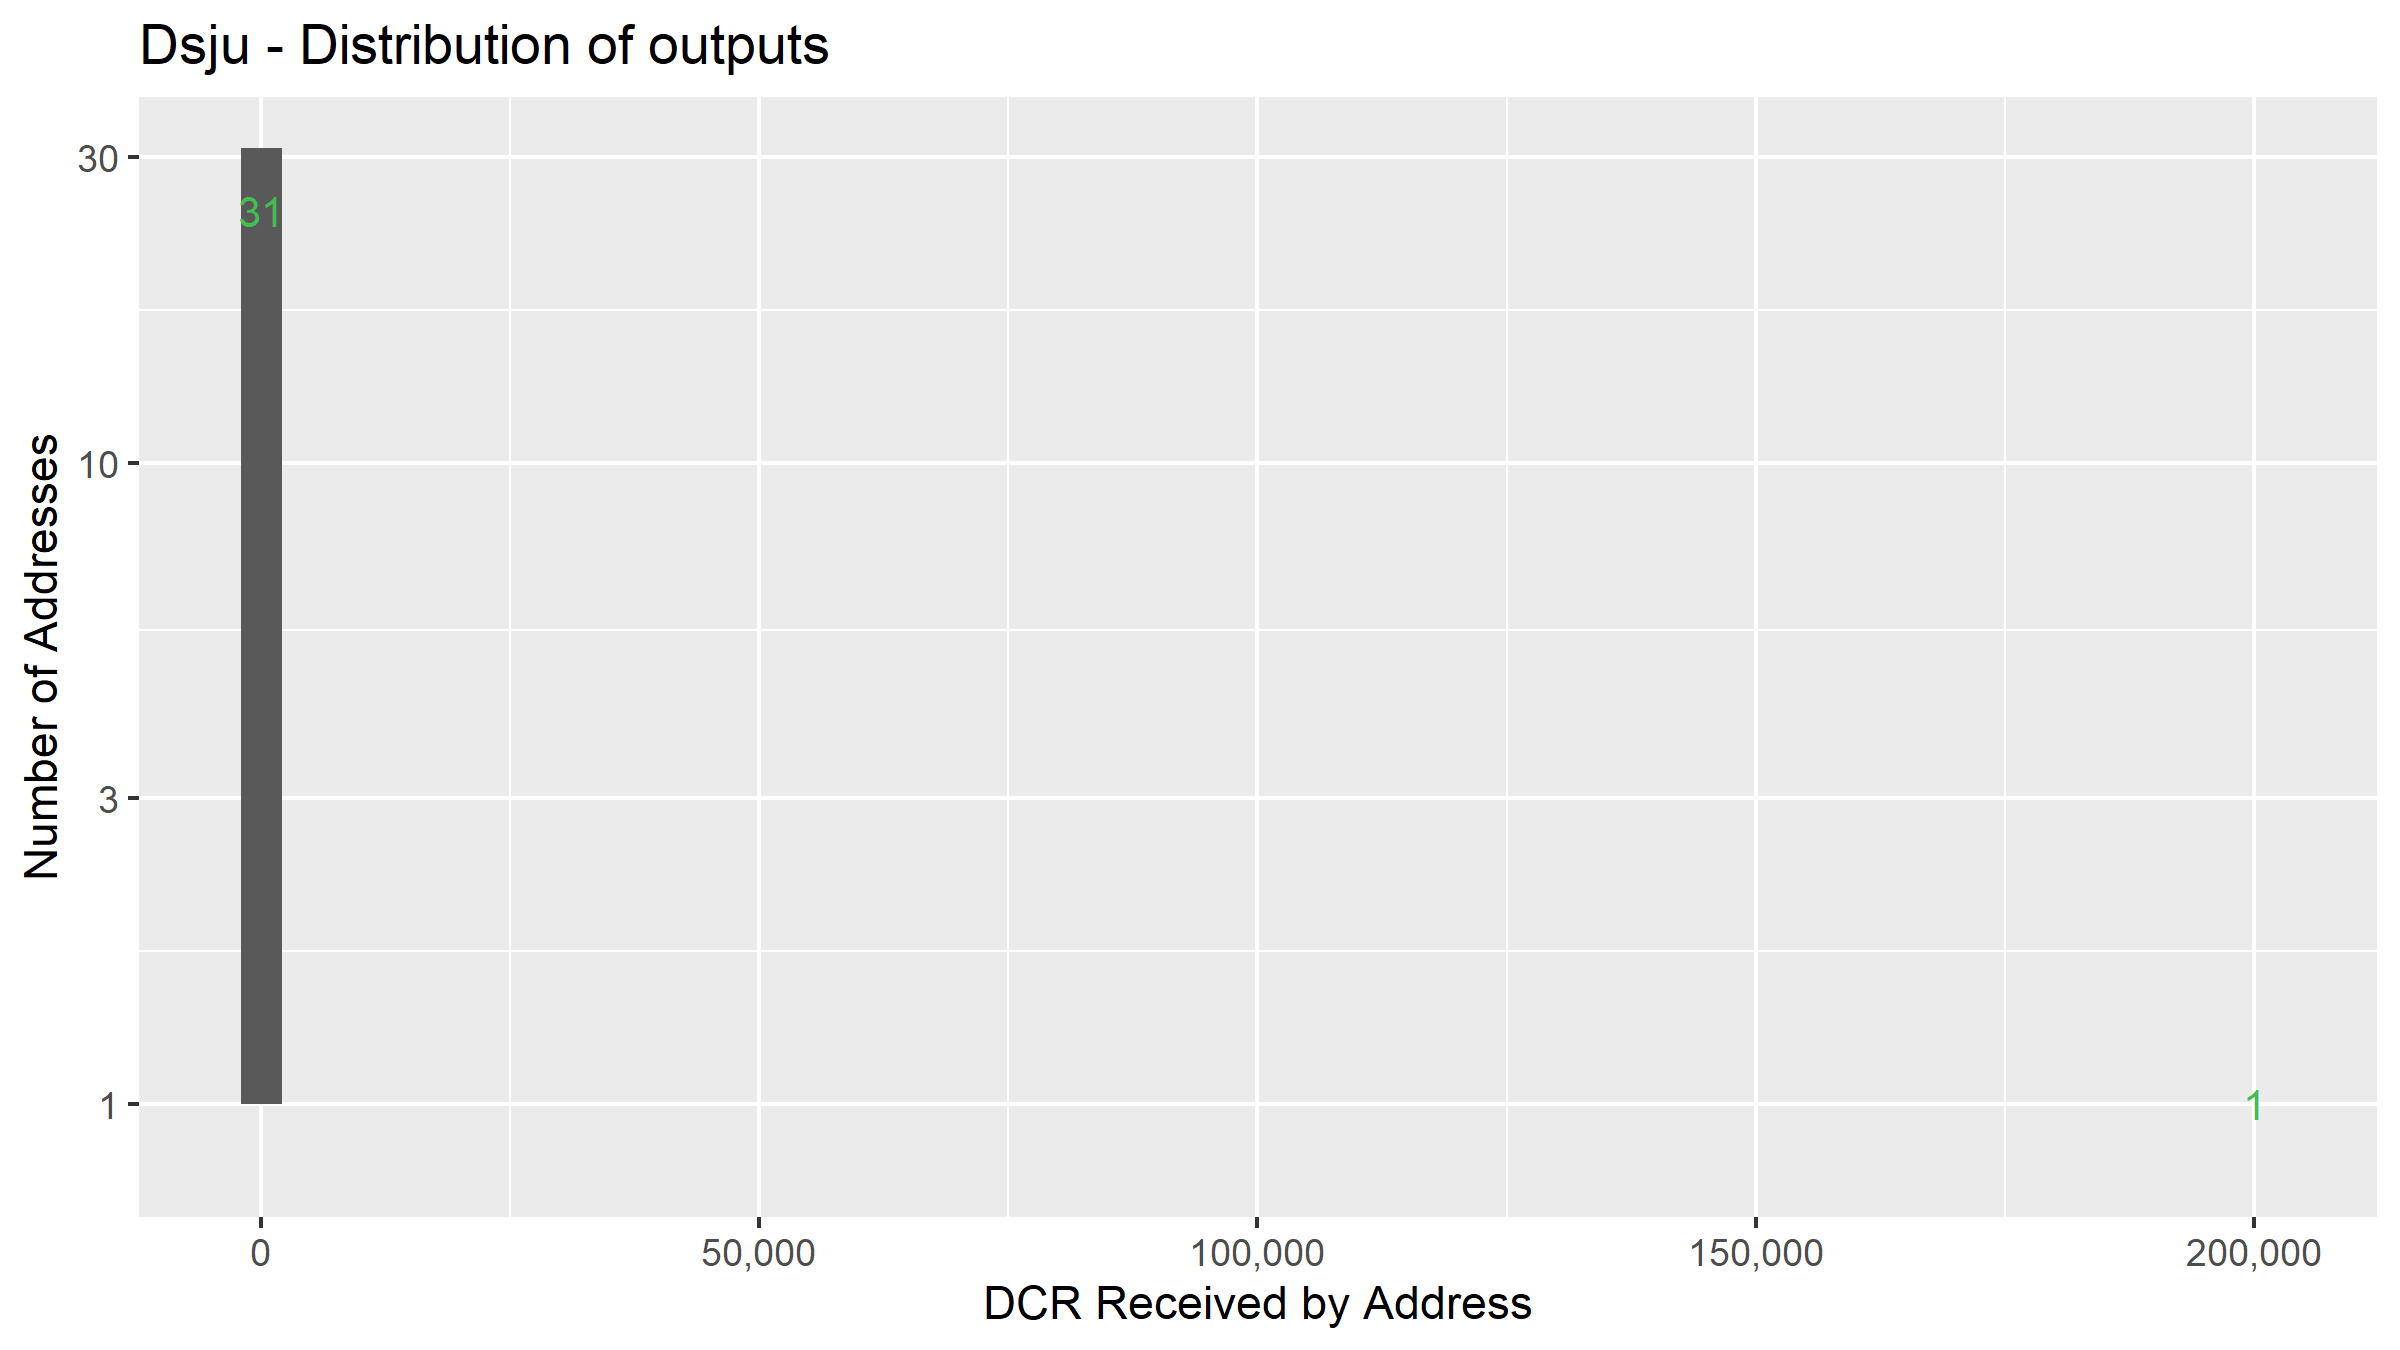
Distribution of outputs for the Dsju cluster
This looks like a solo miner using pool infrastructure, there is only one address which has received DCR from this cluster (DsVy) - the miner makes periodic withdrawals when the balance reaches a few thousand.
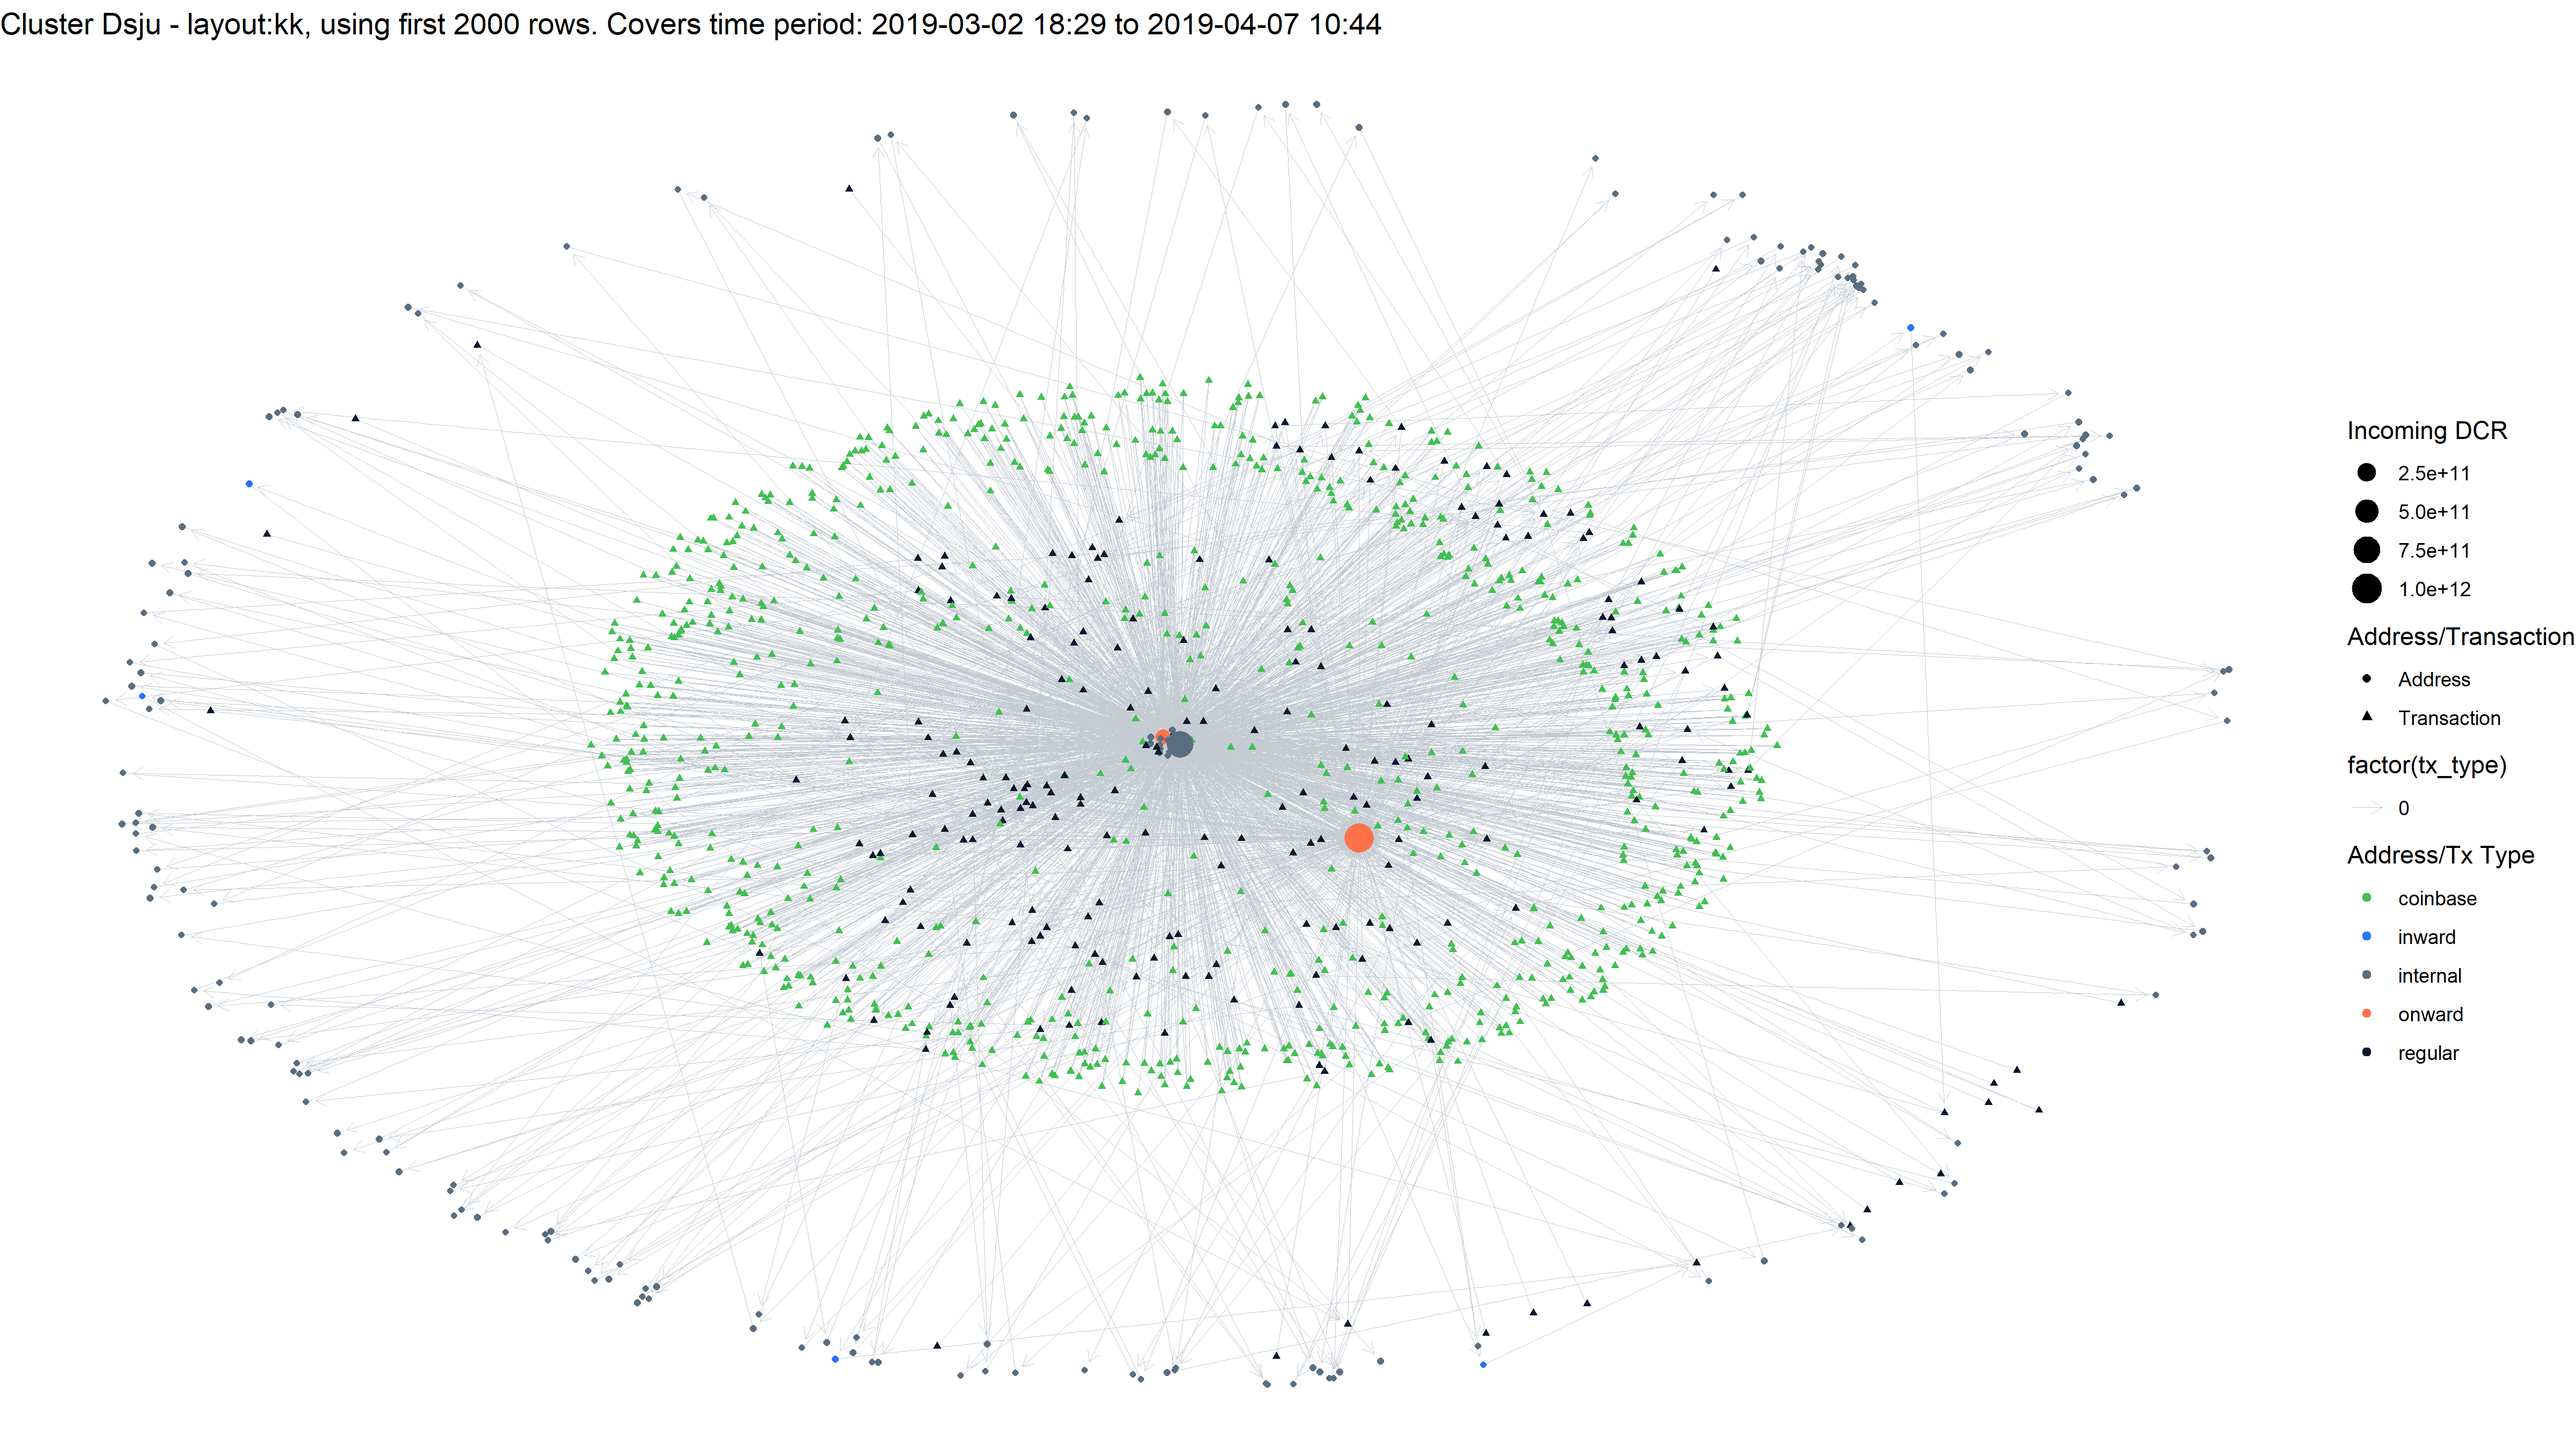
Network visualization for Dsju cluster
5 - DscM
This cluster received 160K DCR, starting from September 2019 and still active. Although the cluster bought 22 tickets it does also seem to operate as a mining pool, with fairly consistent outputs to a range of addresses.
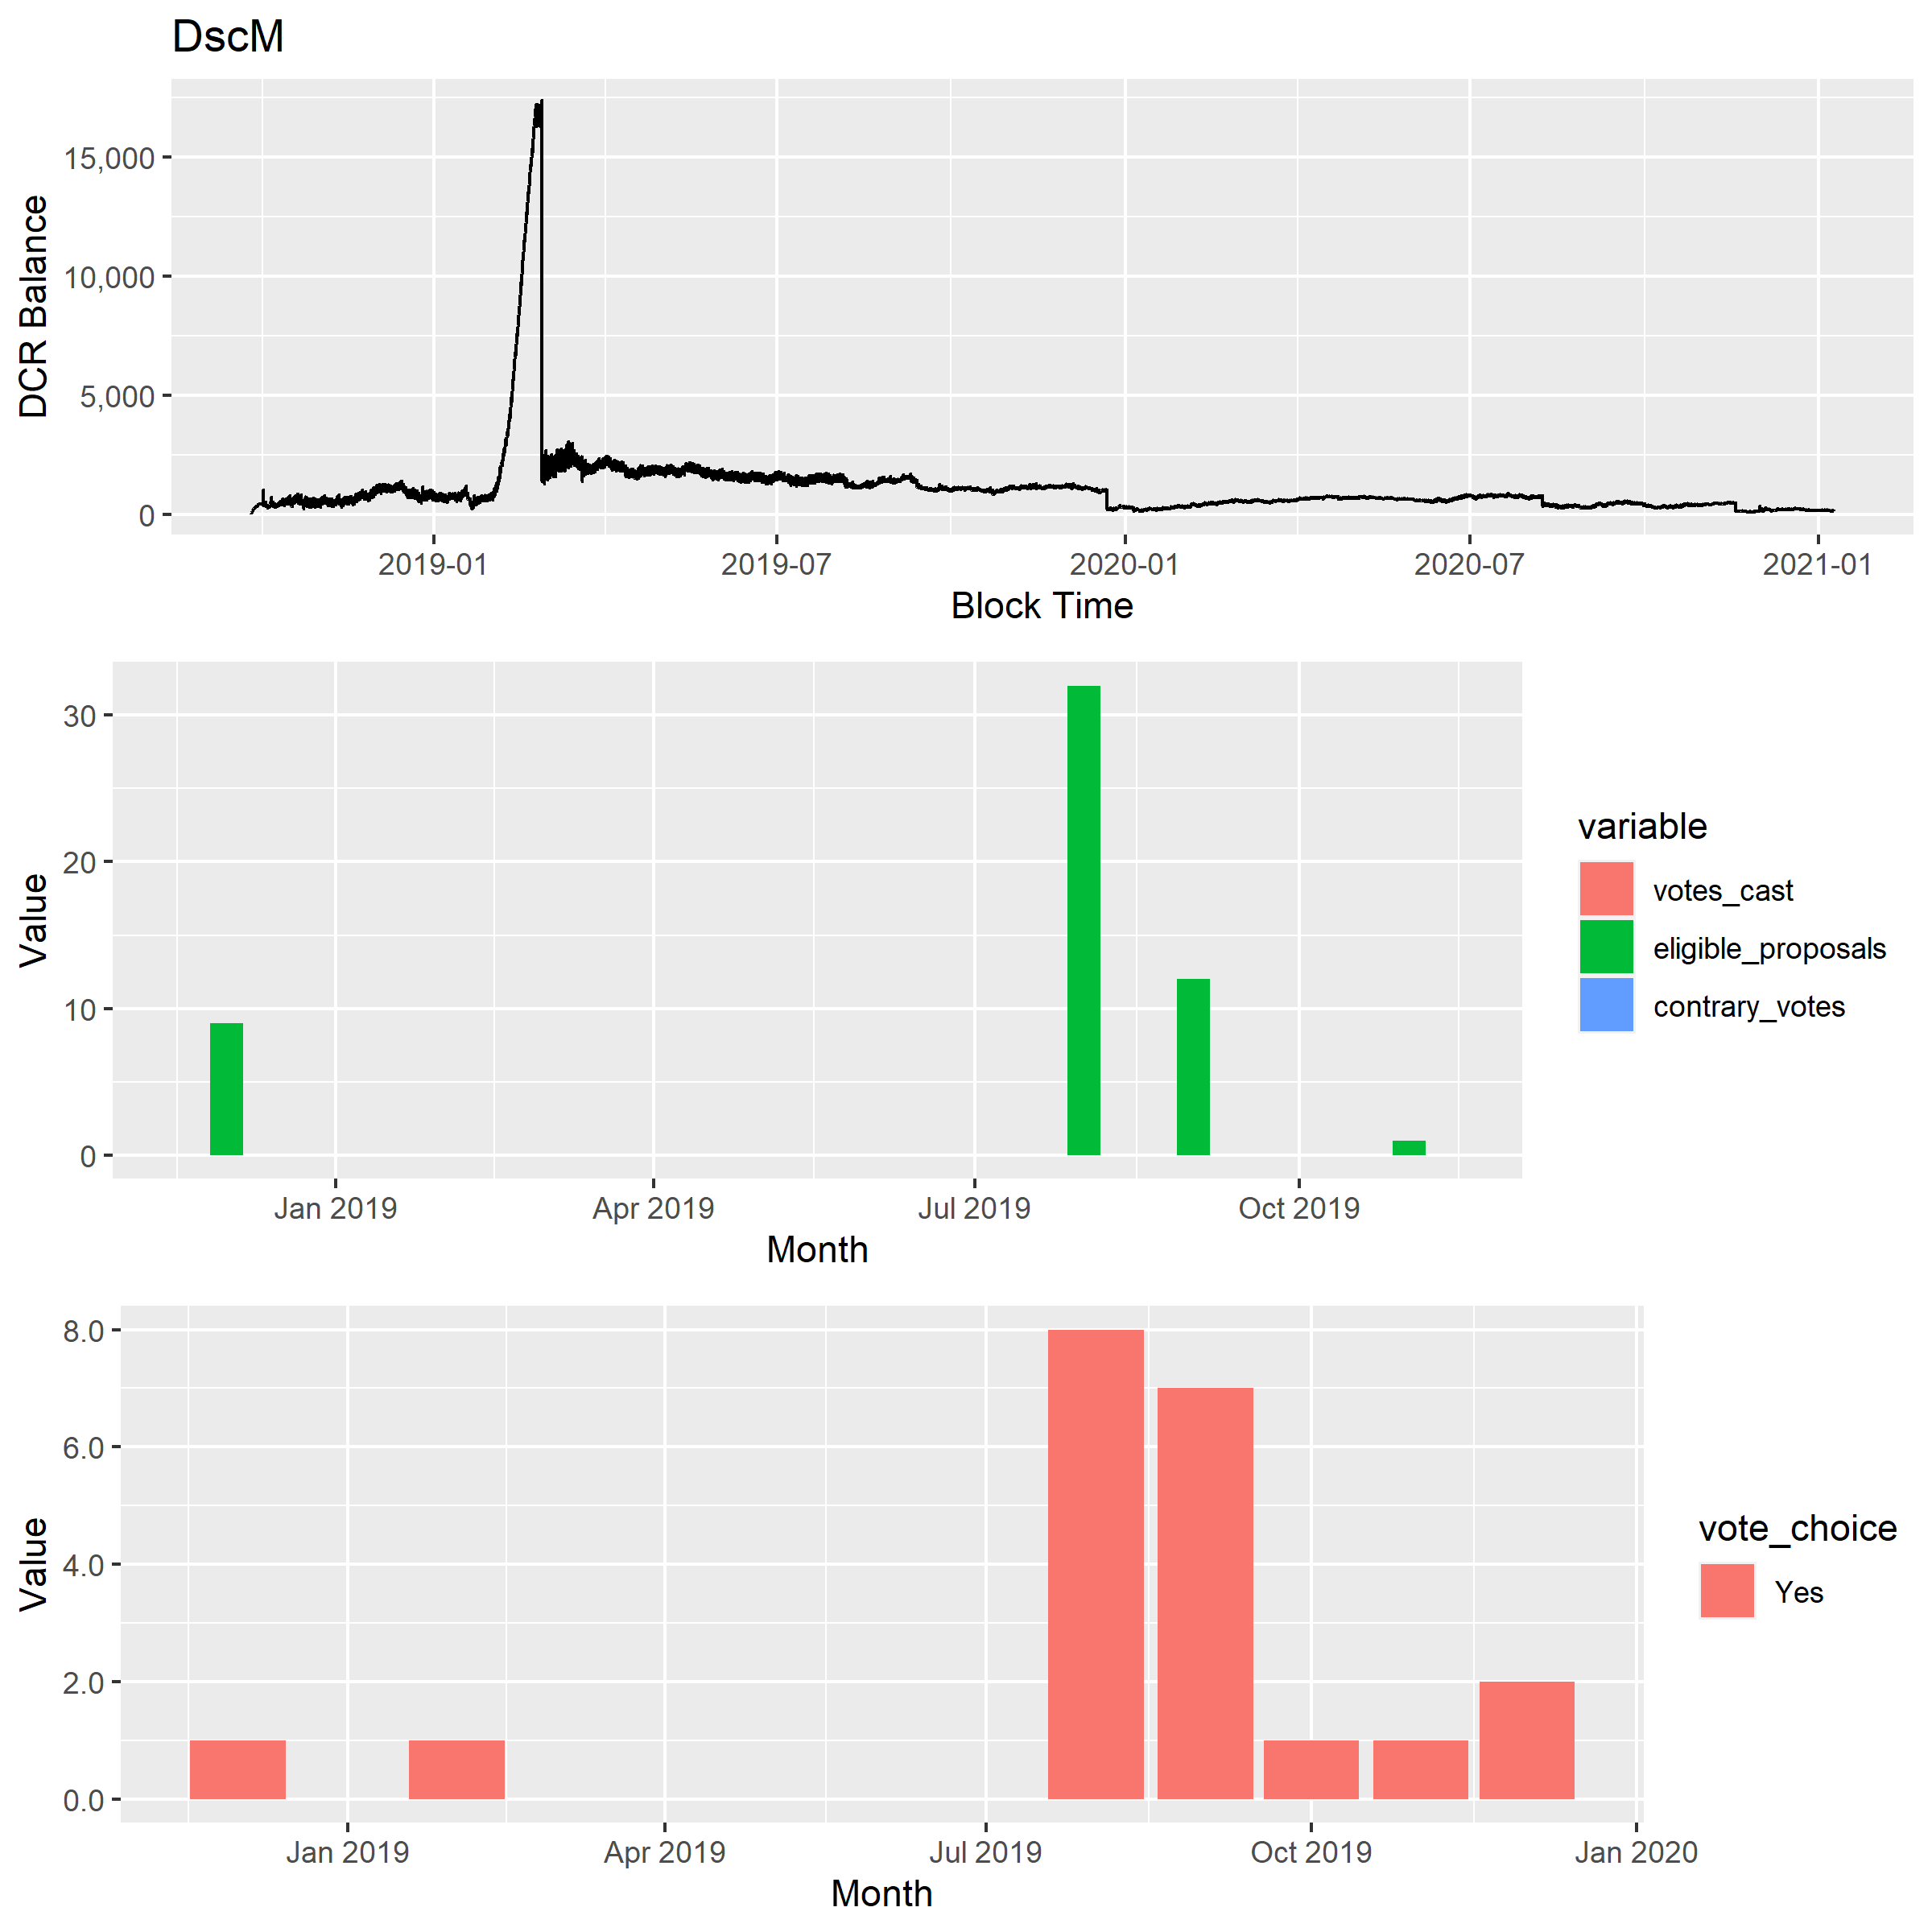
DCR balance and voting of the DscM cluster
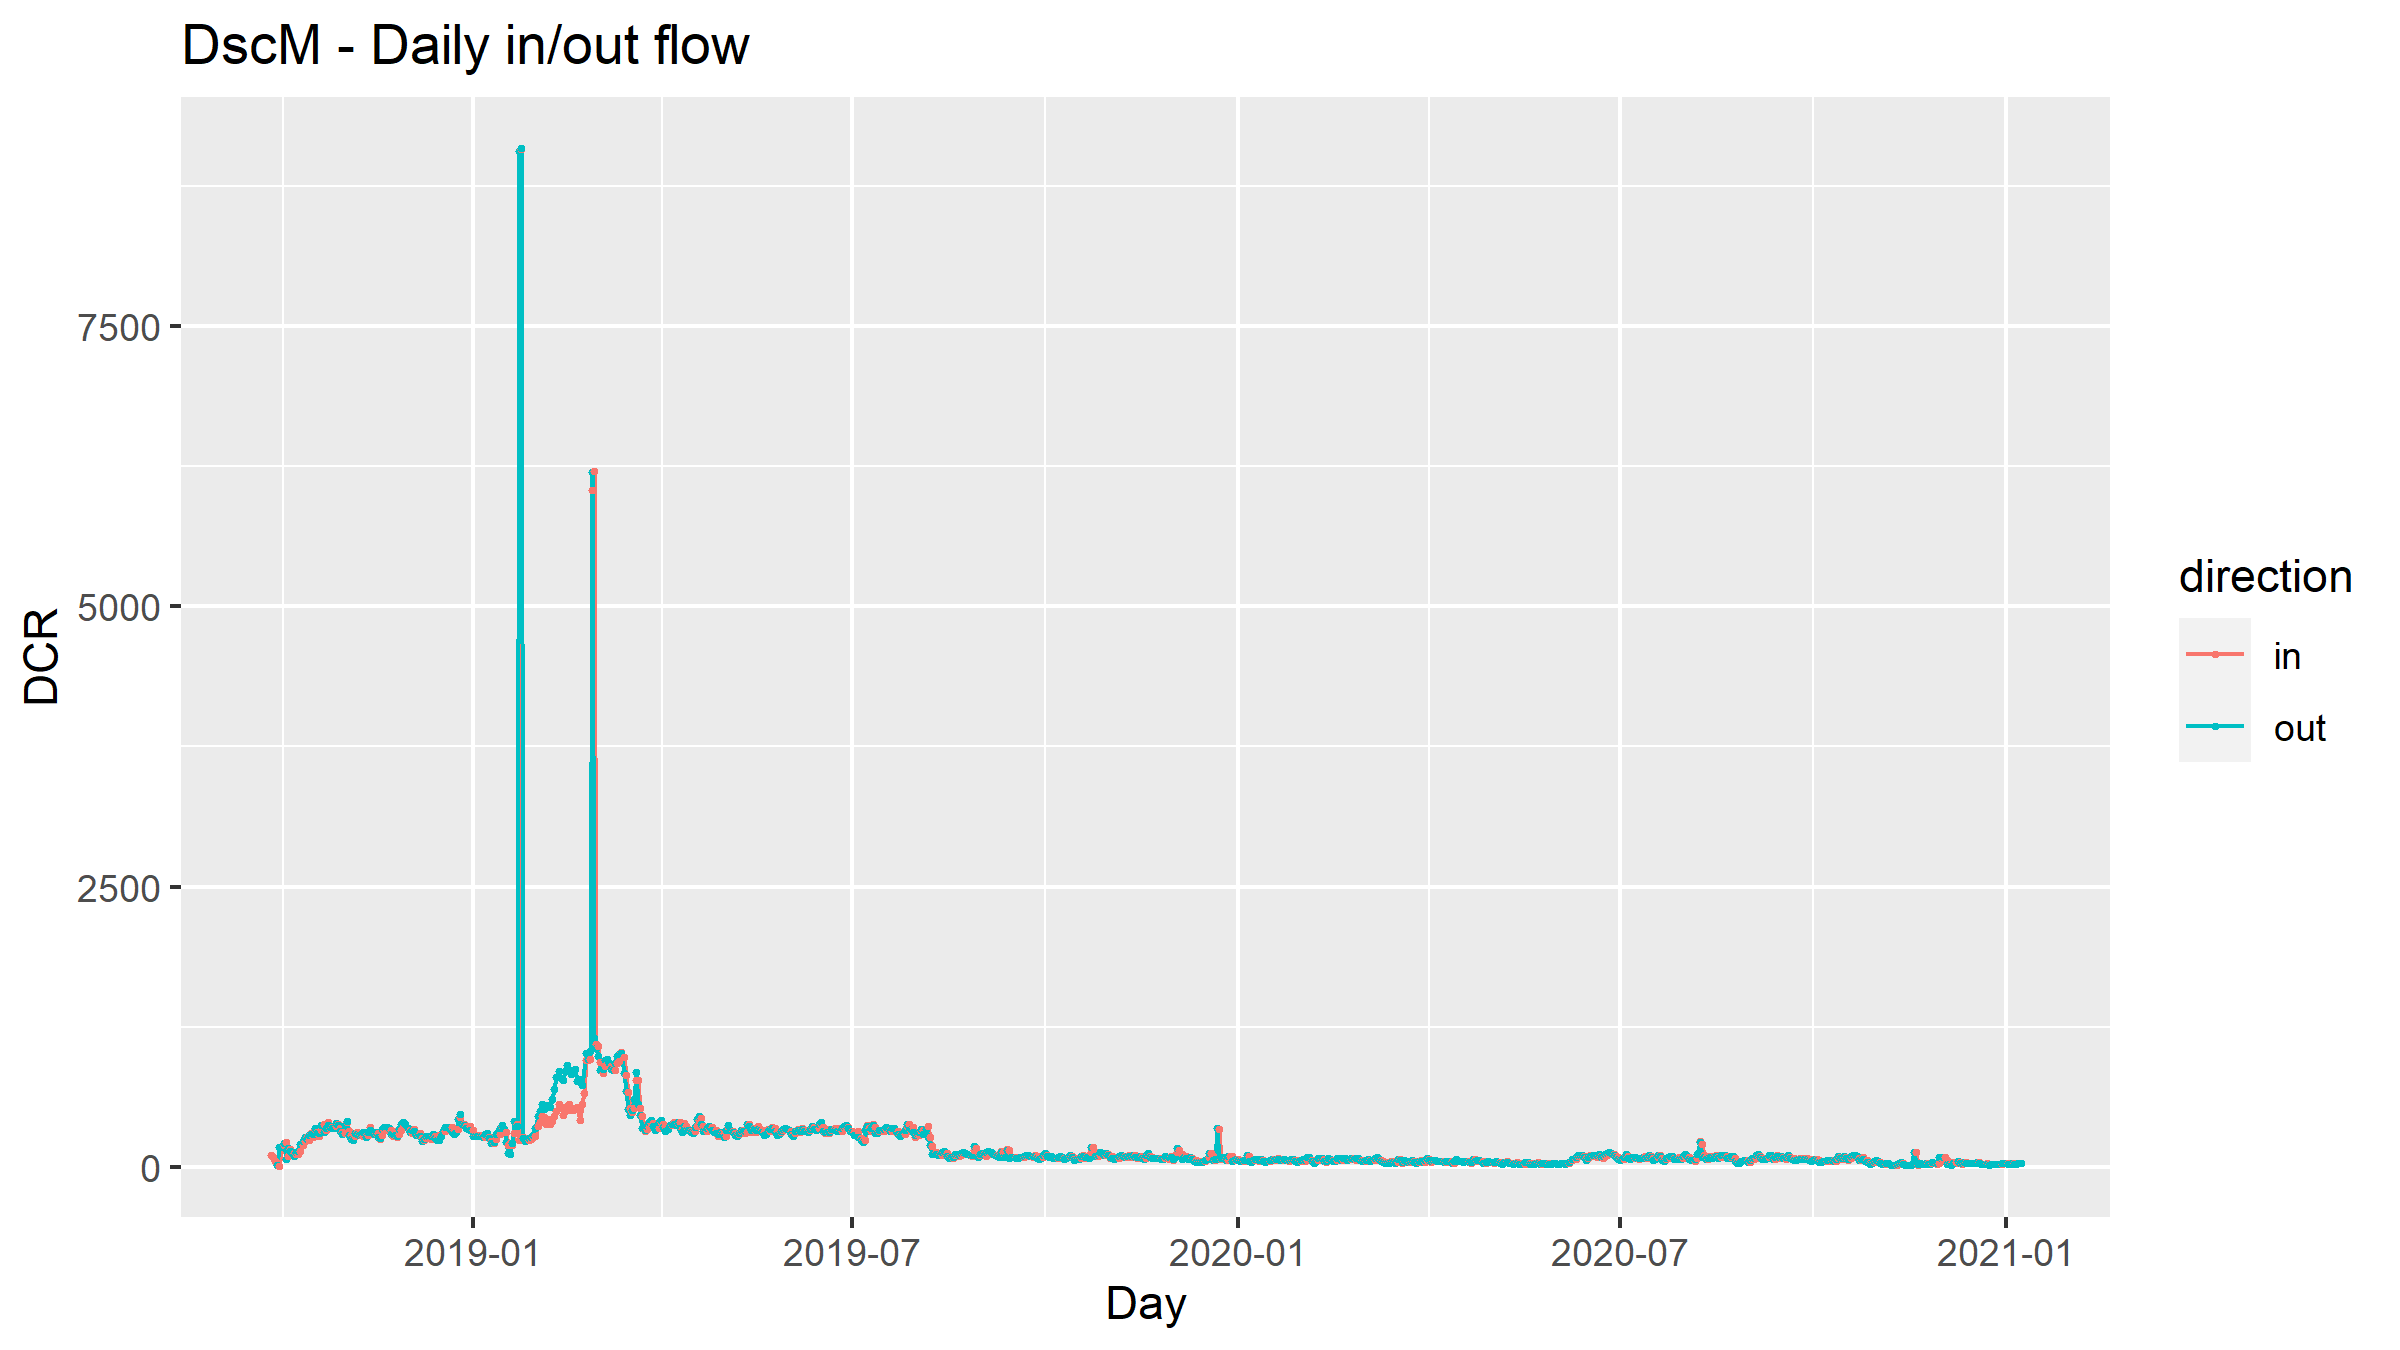
DCR flowing to/from the DscM cluster
Big spikes on the in flow indicate that someone sent DCR to the cluster beyond that which it was mining.
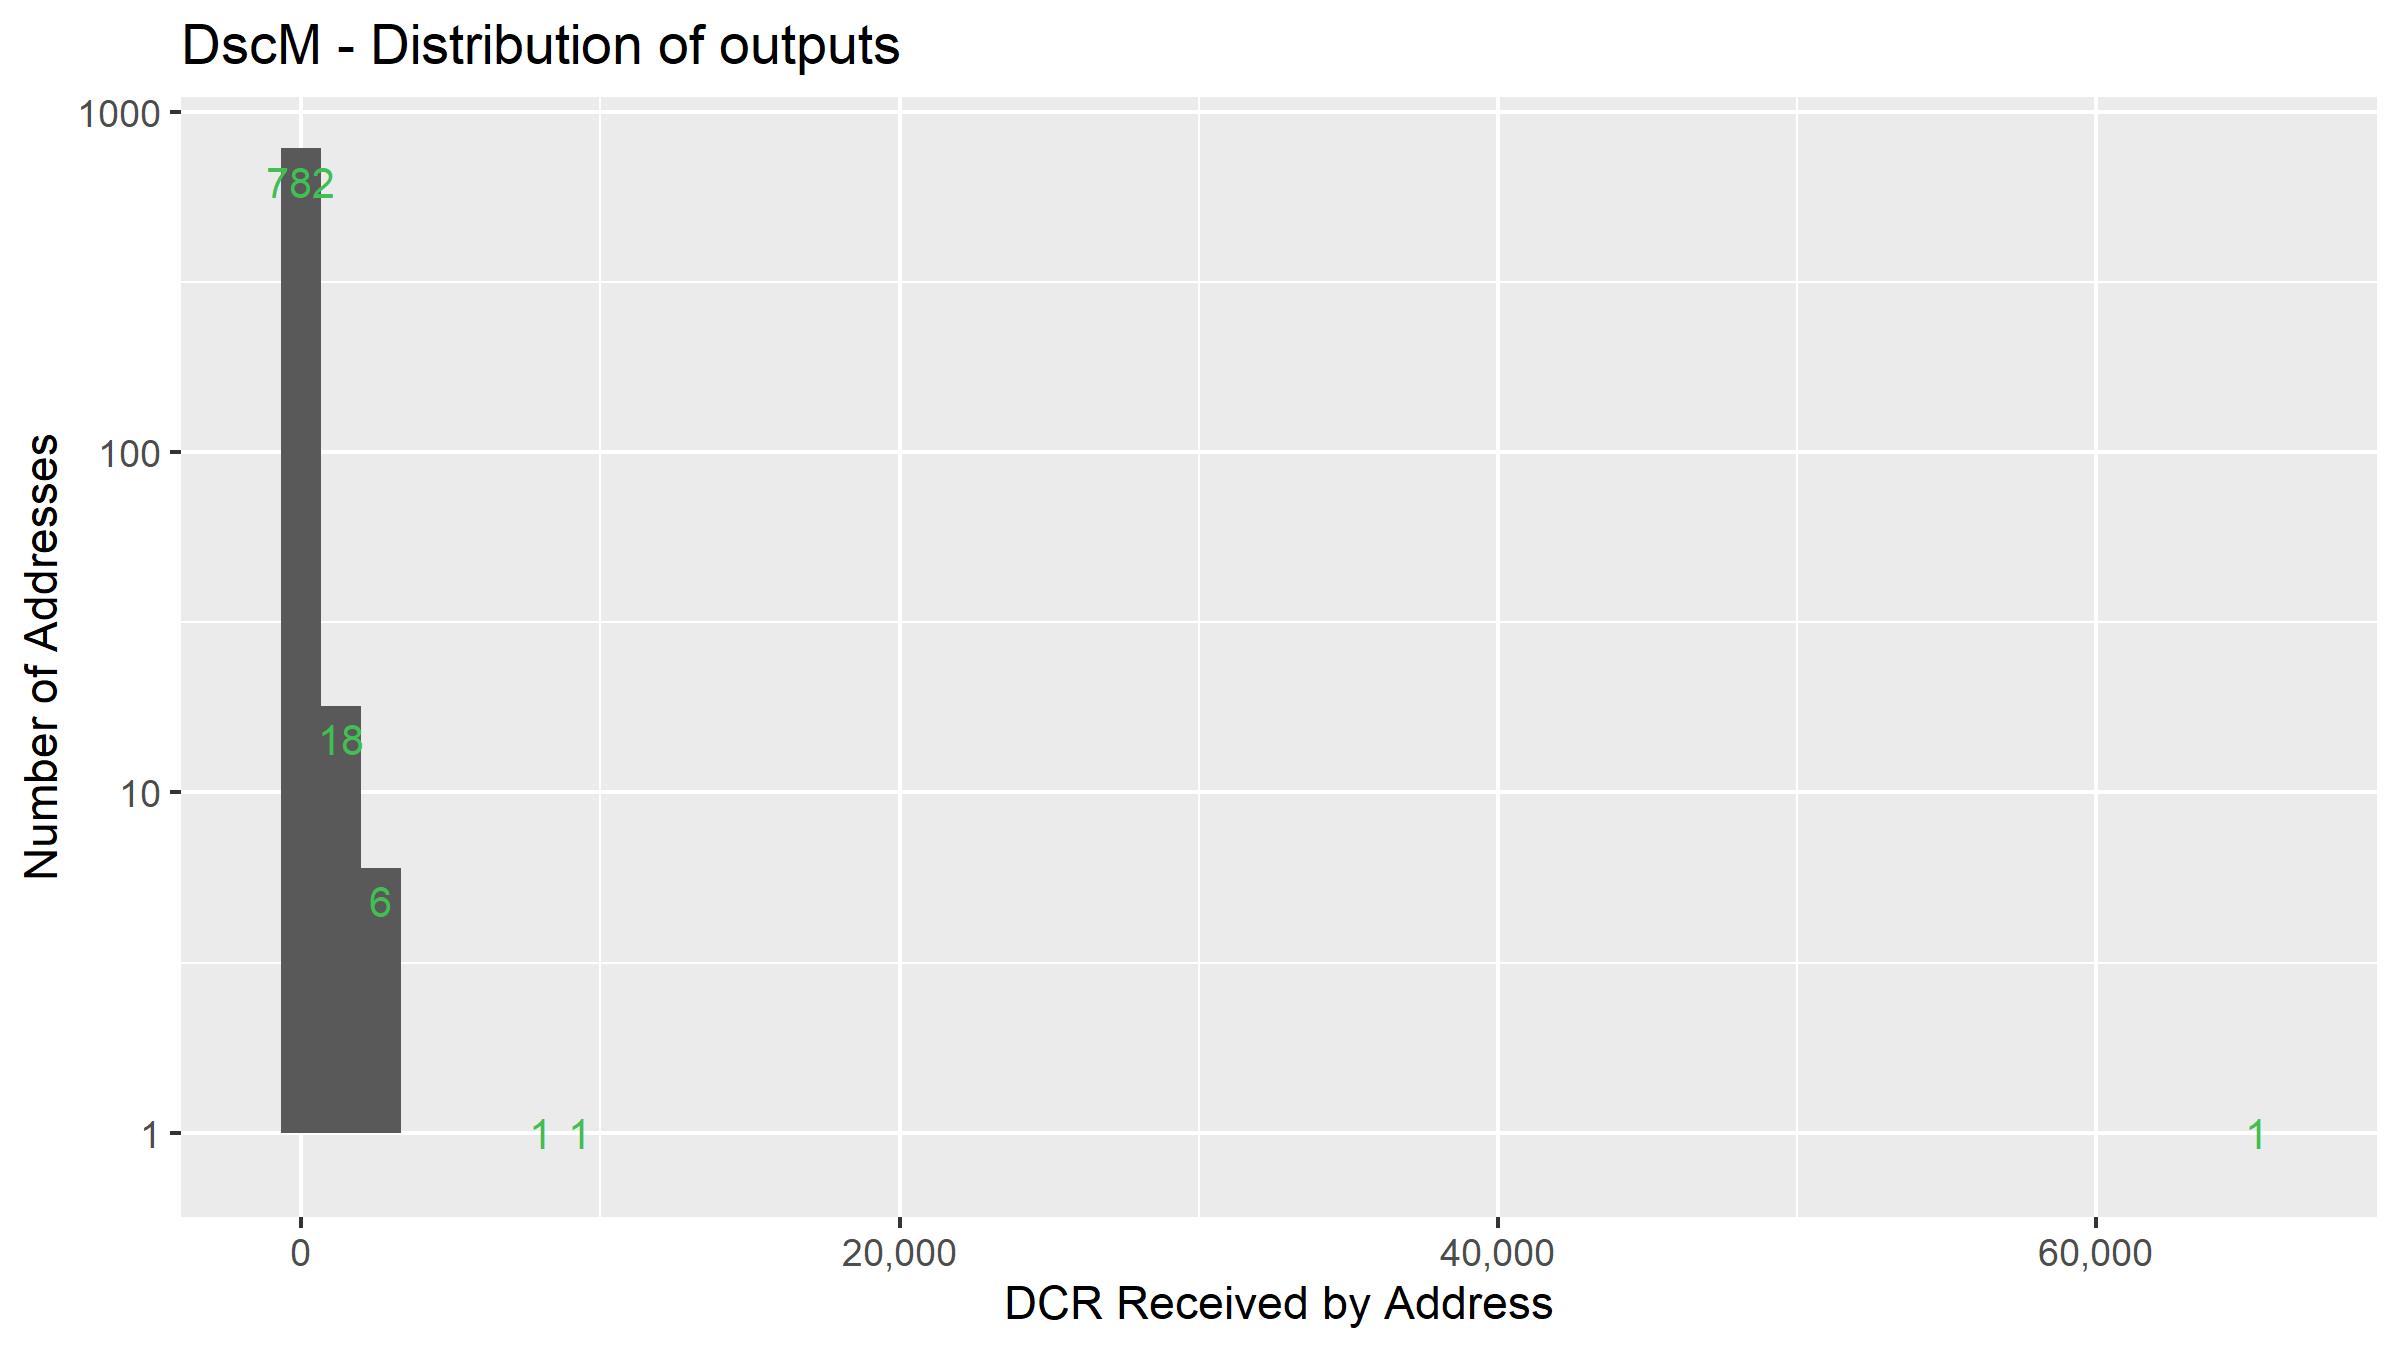
Distribution of outputs for the DscM cluster

Network visualization for DscM cluster
This cluster has hits on all 3 exchanges but a preference for Binance, with 11K DCR going there, and less than 2K for the other two.
Hop 1 Top 5 - Miners in the Pool
1 - DsUb
This cluster started in mid-2018, is still active and has so far received 526K DCR one hop from the coinbase transaction (the source being the second cluster above: 2 - Dsnx).
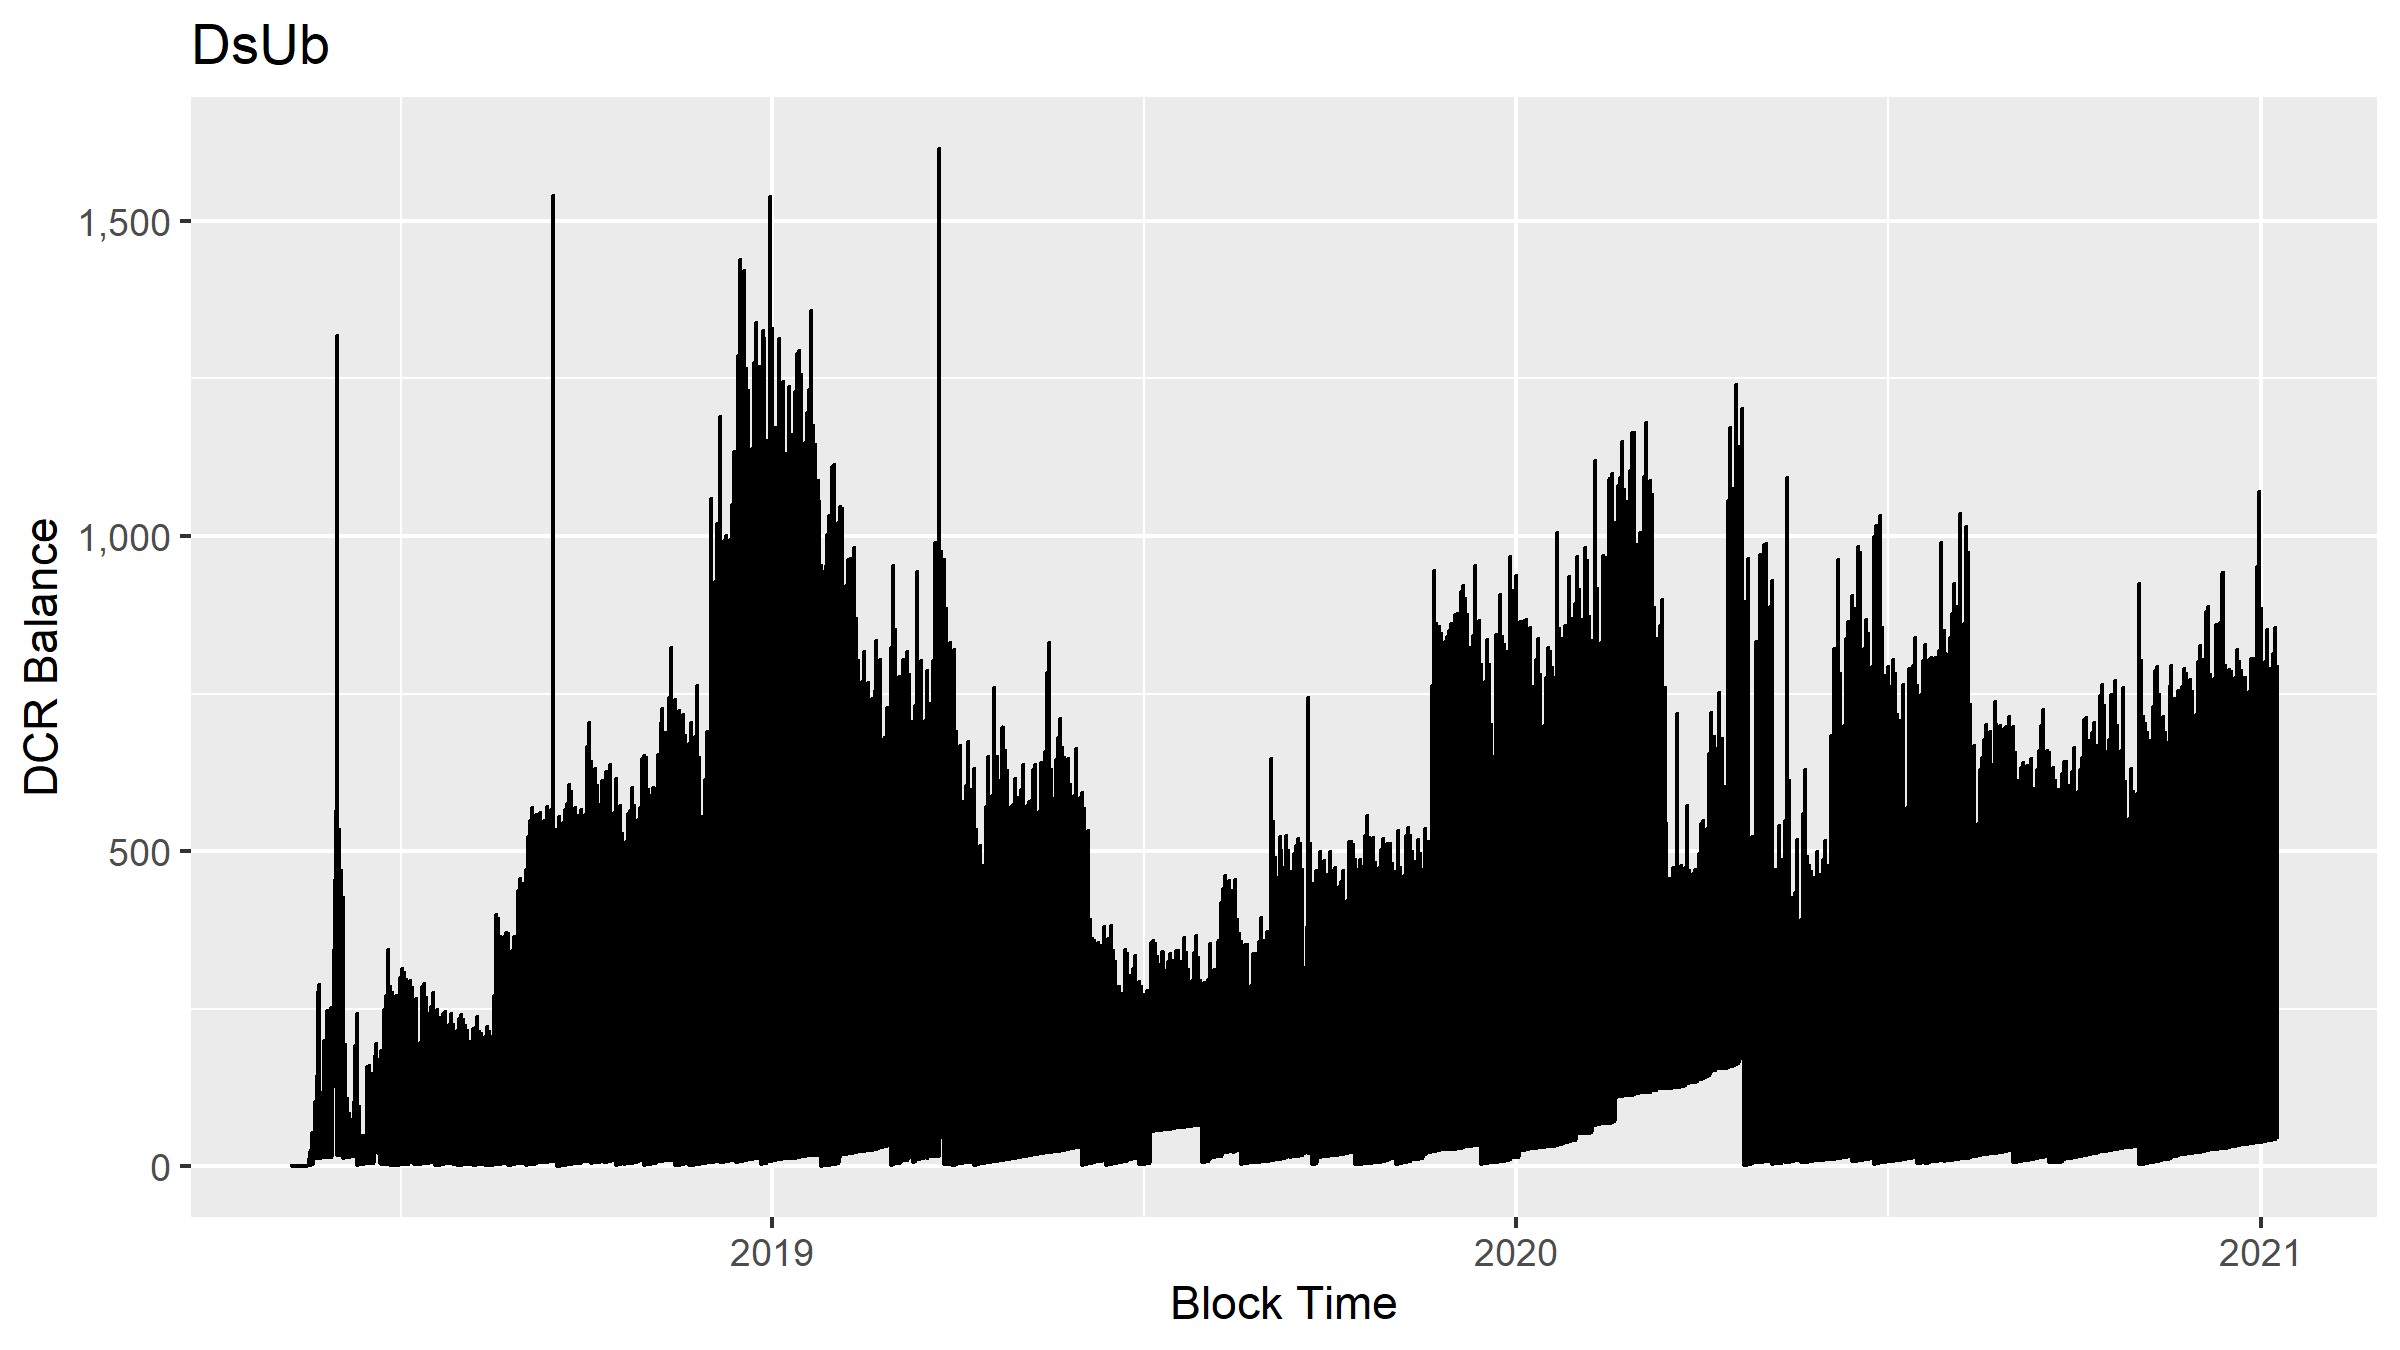
DCR balance of the DsUb cluster
The line for this chart is more choppy because the cluster regularly zeroes its balance.

DCR flowing to/from the DsUb cluster
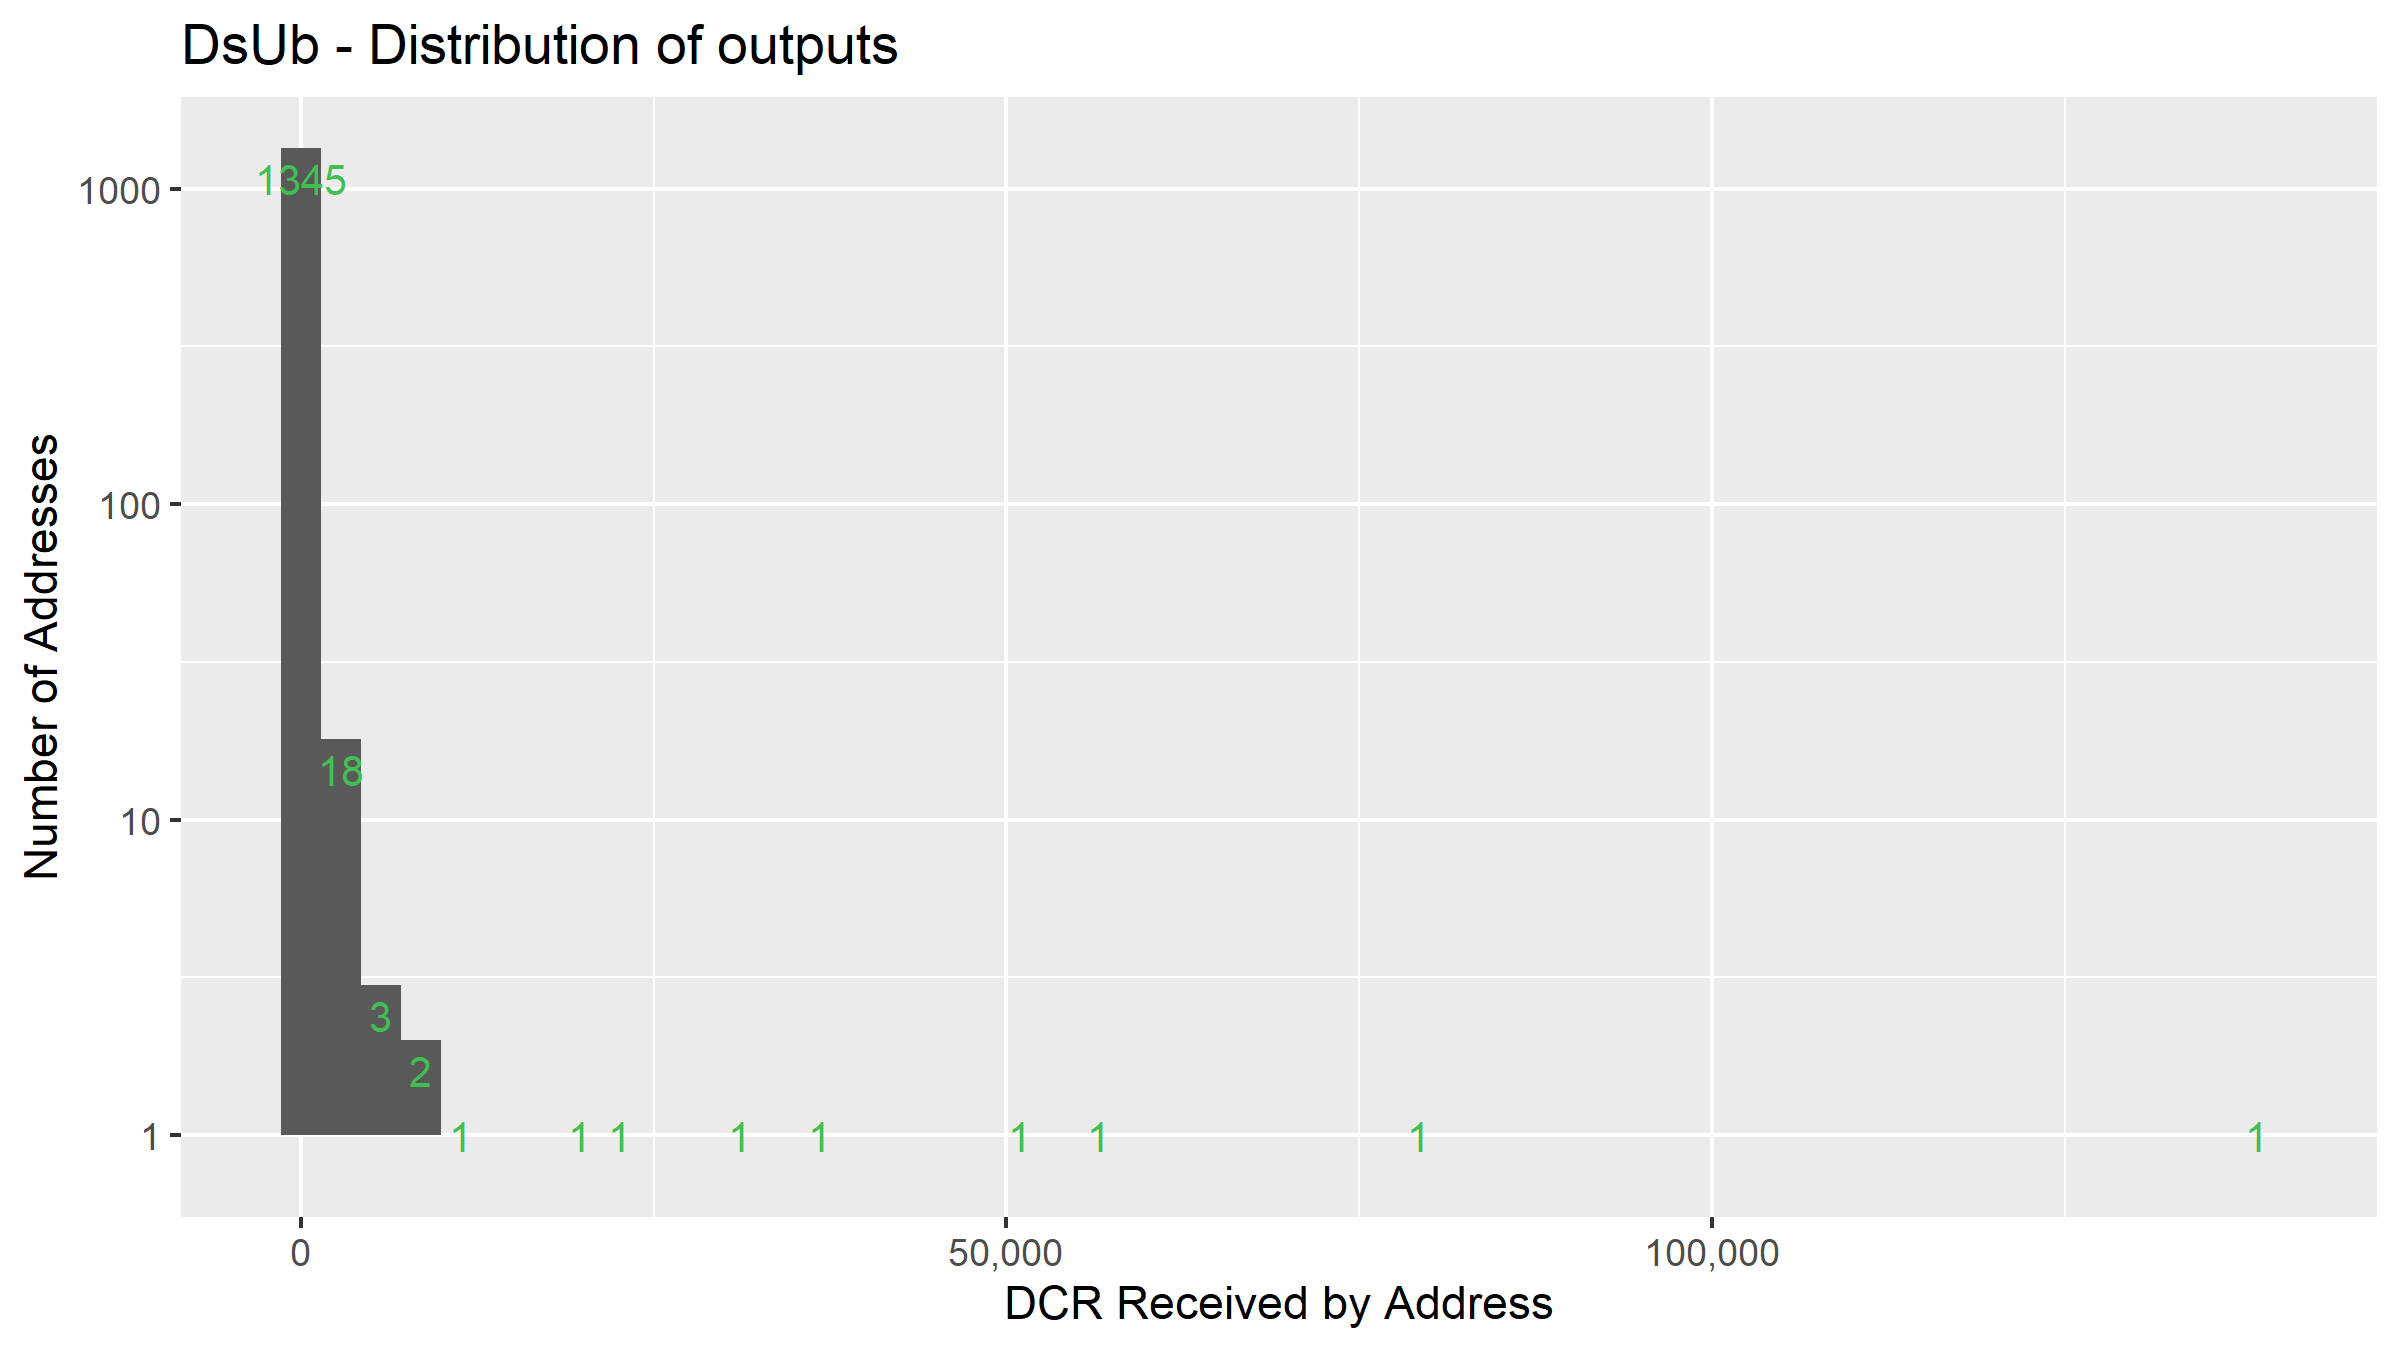
Distribution of outputs for the DsUb cluster
This one looks like it could be a second level mining pool. I’m not sure what the purpose is of pooling the funds in one address before sending to another for distribution to miners, but that’s how this pool seems to be operating. The address which received the largest share of these payouts got 139K DCR, I had a quick look and it sent 71.5K to Binance, 2.5K to Bittrex and 1.6K to Poloniex.
The second address in the outputs ranking for this cluster (DsgK) is featured below because it also received mined DCR from somewhere else.
This cluster has sent to 1,377 different addresses which are not part of the cluster, most of these are probably payouts to miners. Among the payees here are some exchange deposit addresses, including 71.5K DCR going to 111 different Binance addresses, 2,543 DCR to 119 Bittrex addresses, and 1,637 DCR to 44 Poloniex addresses. I take this as further sign that this cluster represents pool infrastructure, or else someone creating a lot of different exchange accounts to appear as many users.
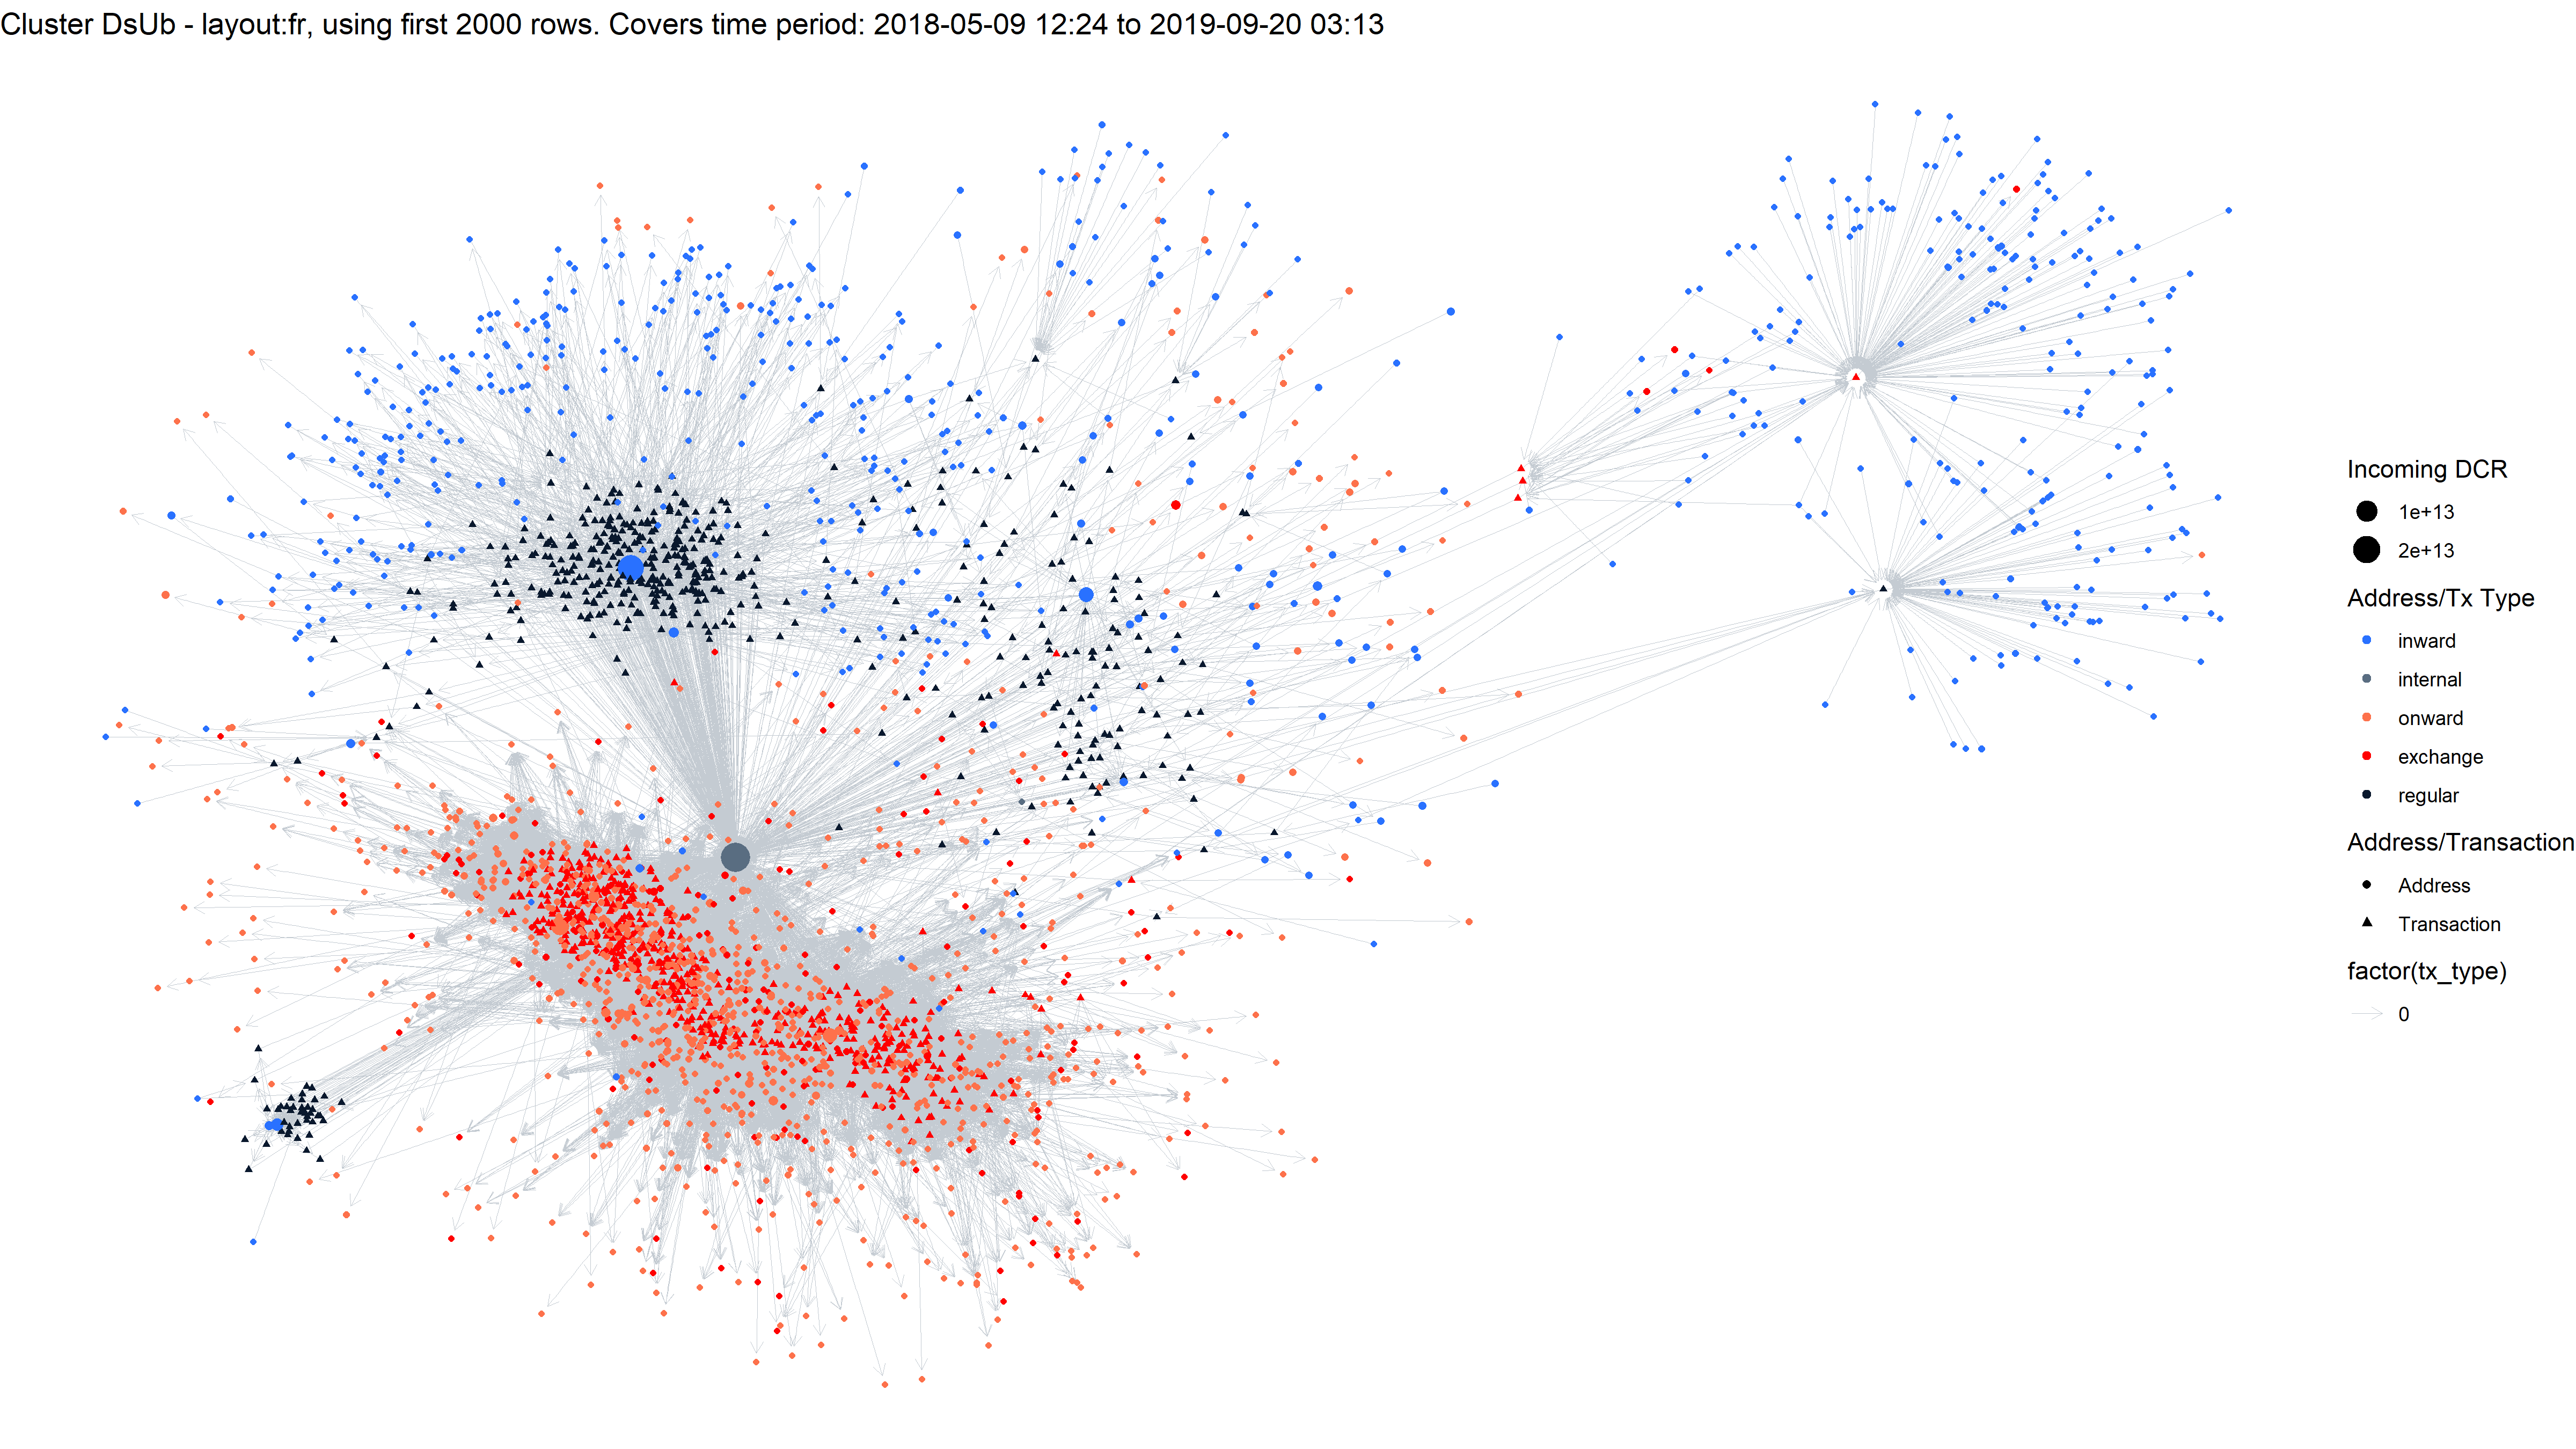
Network visualization for DsUb cluster
2 - DshF
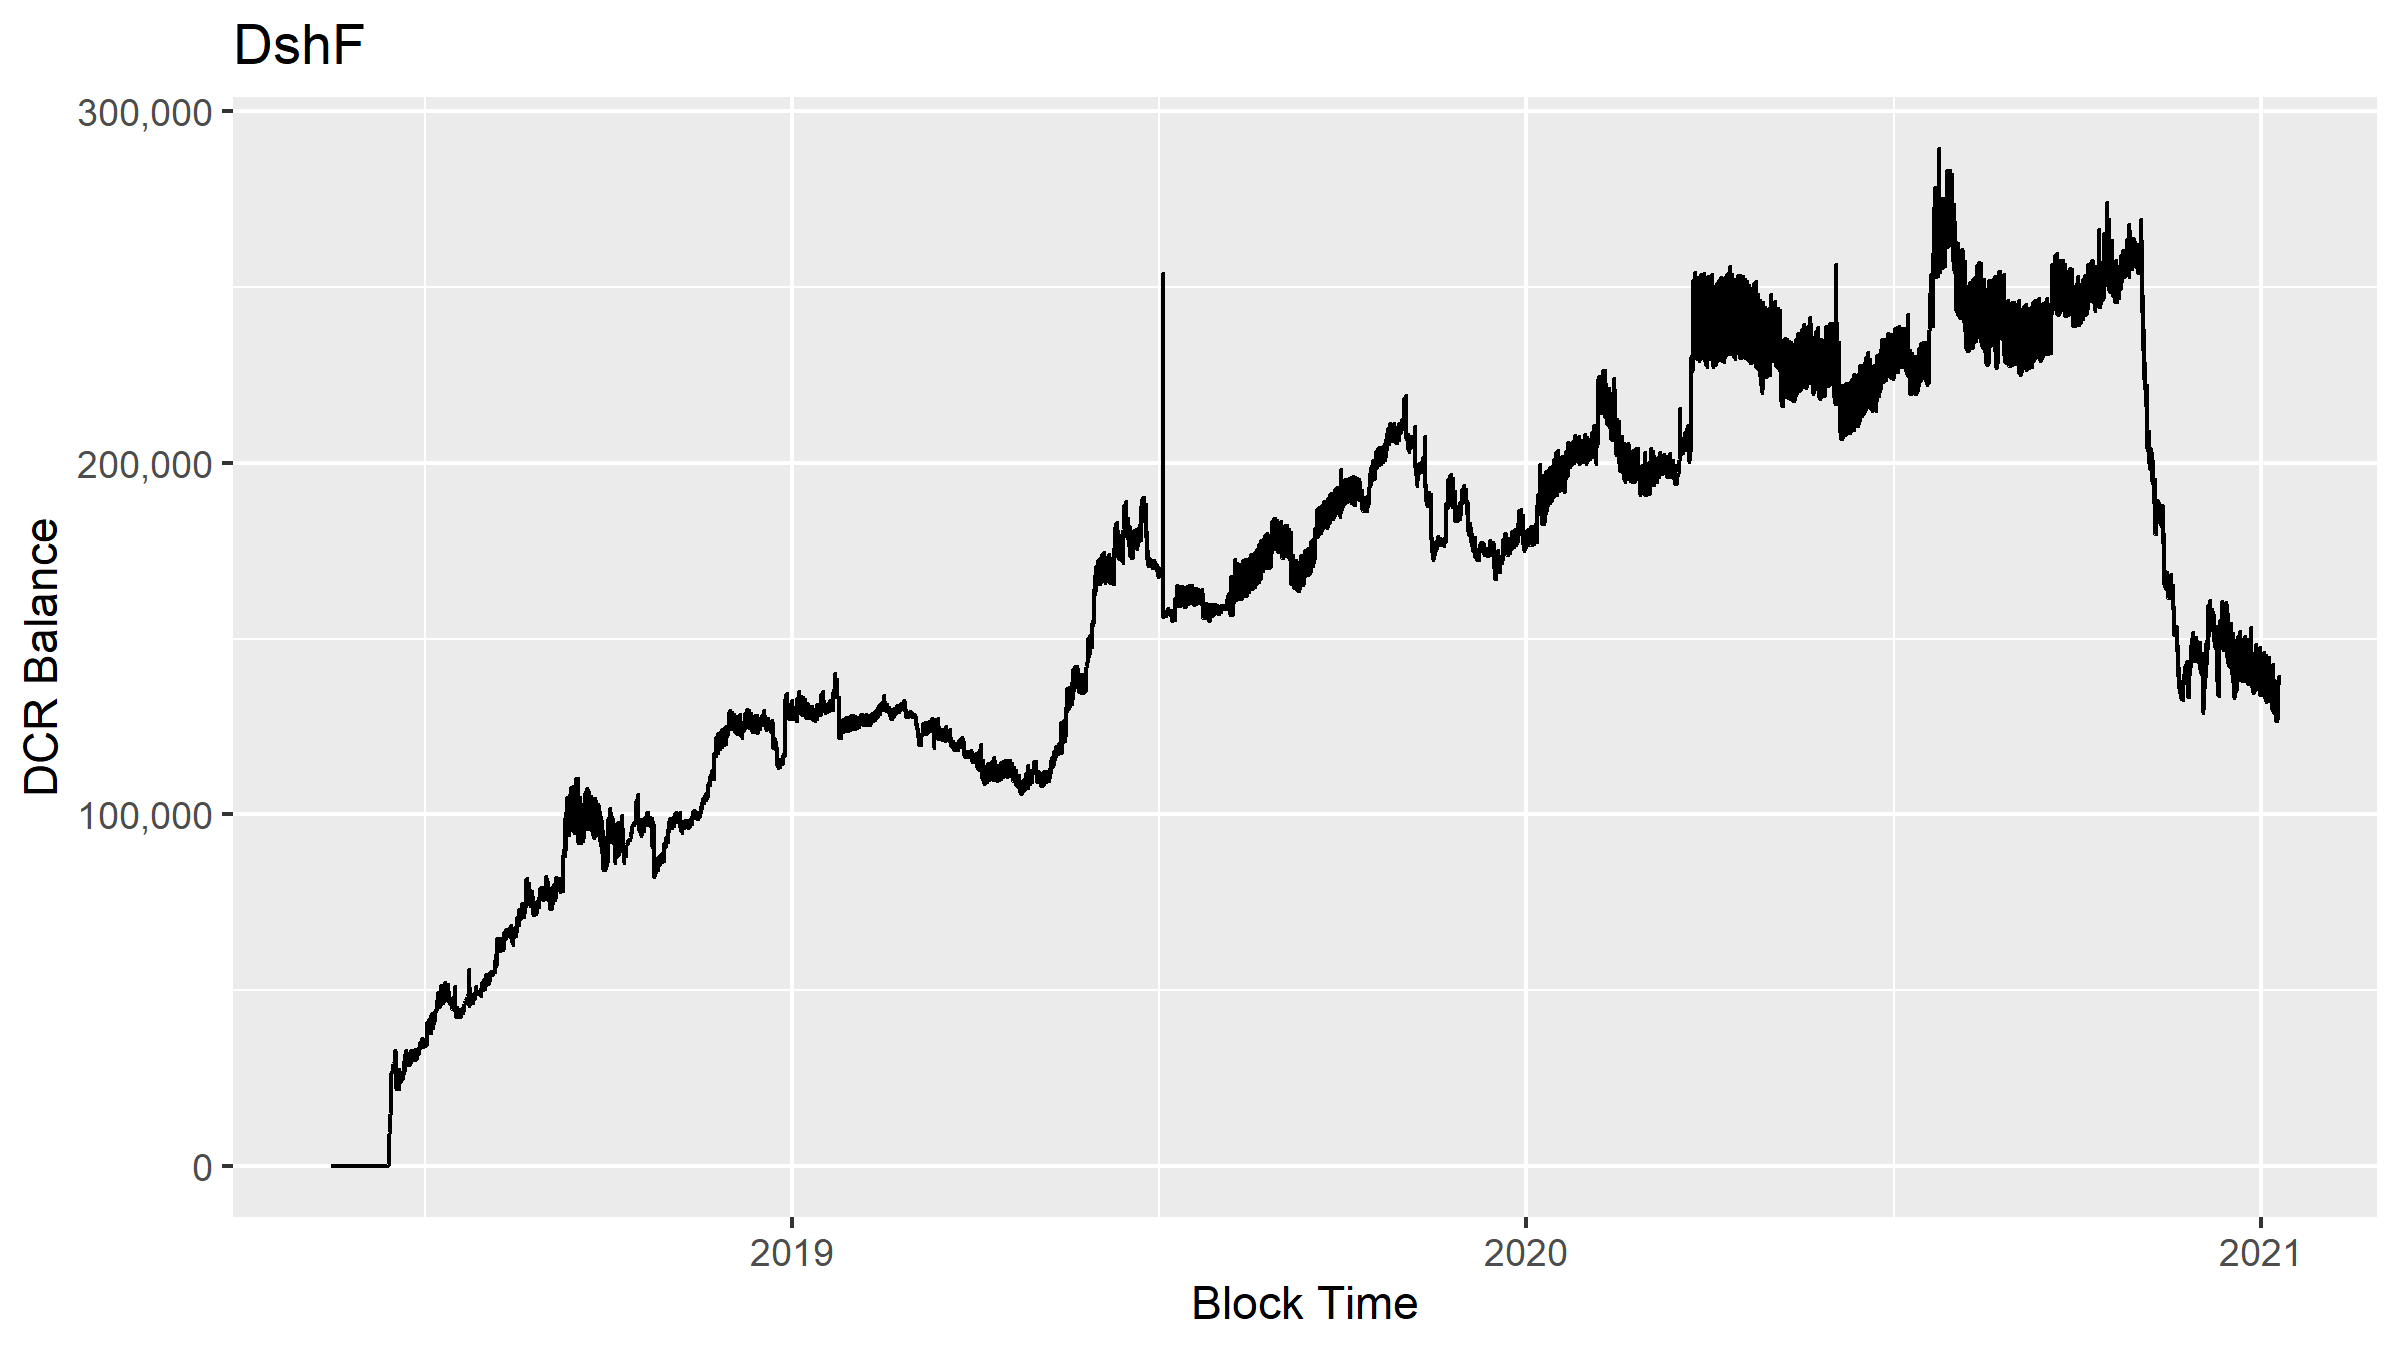
This cluster started up in May 2018 and has received 292K DCR at hop 1 from the coinbase (it has also received 73K directly in PoW rewards and some more at hop 2). This cluster also has some hits on the Airdrop and Treasury flow trackers - 174 airdrop DCR was sent to addresses controlled by this cluster, as well as 1132 DCR at 1 hop from the Treasury - there are 4 transactions where a Decred contractor seems to have sent DCR to addresses in this cluster. This cluster also received 680 mixed DCR from somewhere. Whatever they’re doing, it encompasses more than running a mining pool.
DCR balance of the DshF cluster
The cluster retains a significant DCR balance.

DCR flowing to/from the DshF cluster

Distribution of outputs for the DshF cluster
There are many addresses which each received a little DCR from this cluster, but a few which have received a lot, with one address getting over 300K from this cluster. I applied a log transformation to the y axis in this plot, this caused the bars for single cases to disappear so I added numbers for the bars.
This cluster has received DCR from sources other than mining, and it has sent a lot of DCR to exchanges - 832K to Binance, 349K to Bittrex and 99K to Poloniex. The number and pattern of these exchange deposits indicate that this cluster probably covers many distinct users - but why that is tangled up with a significant DCR balance I’m not sure. It is possible that something is not 100% with the clustering in this case, but I have yet to identify any underlying issues in this data. This may also be what the wallet looks like for an entity which provides some other services as well as a mining pool, like an OTC desk or custodial solution.
Network visualization for Dshf cluster
3 - DsgK
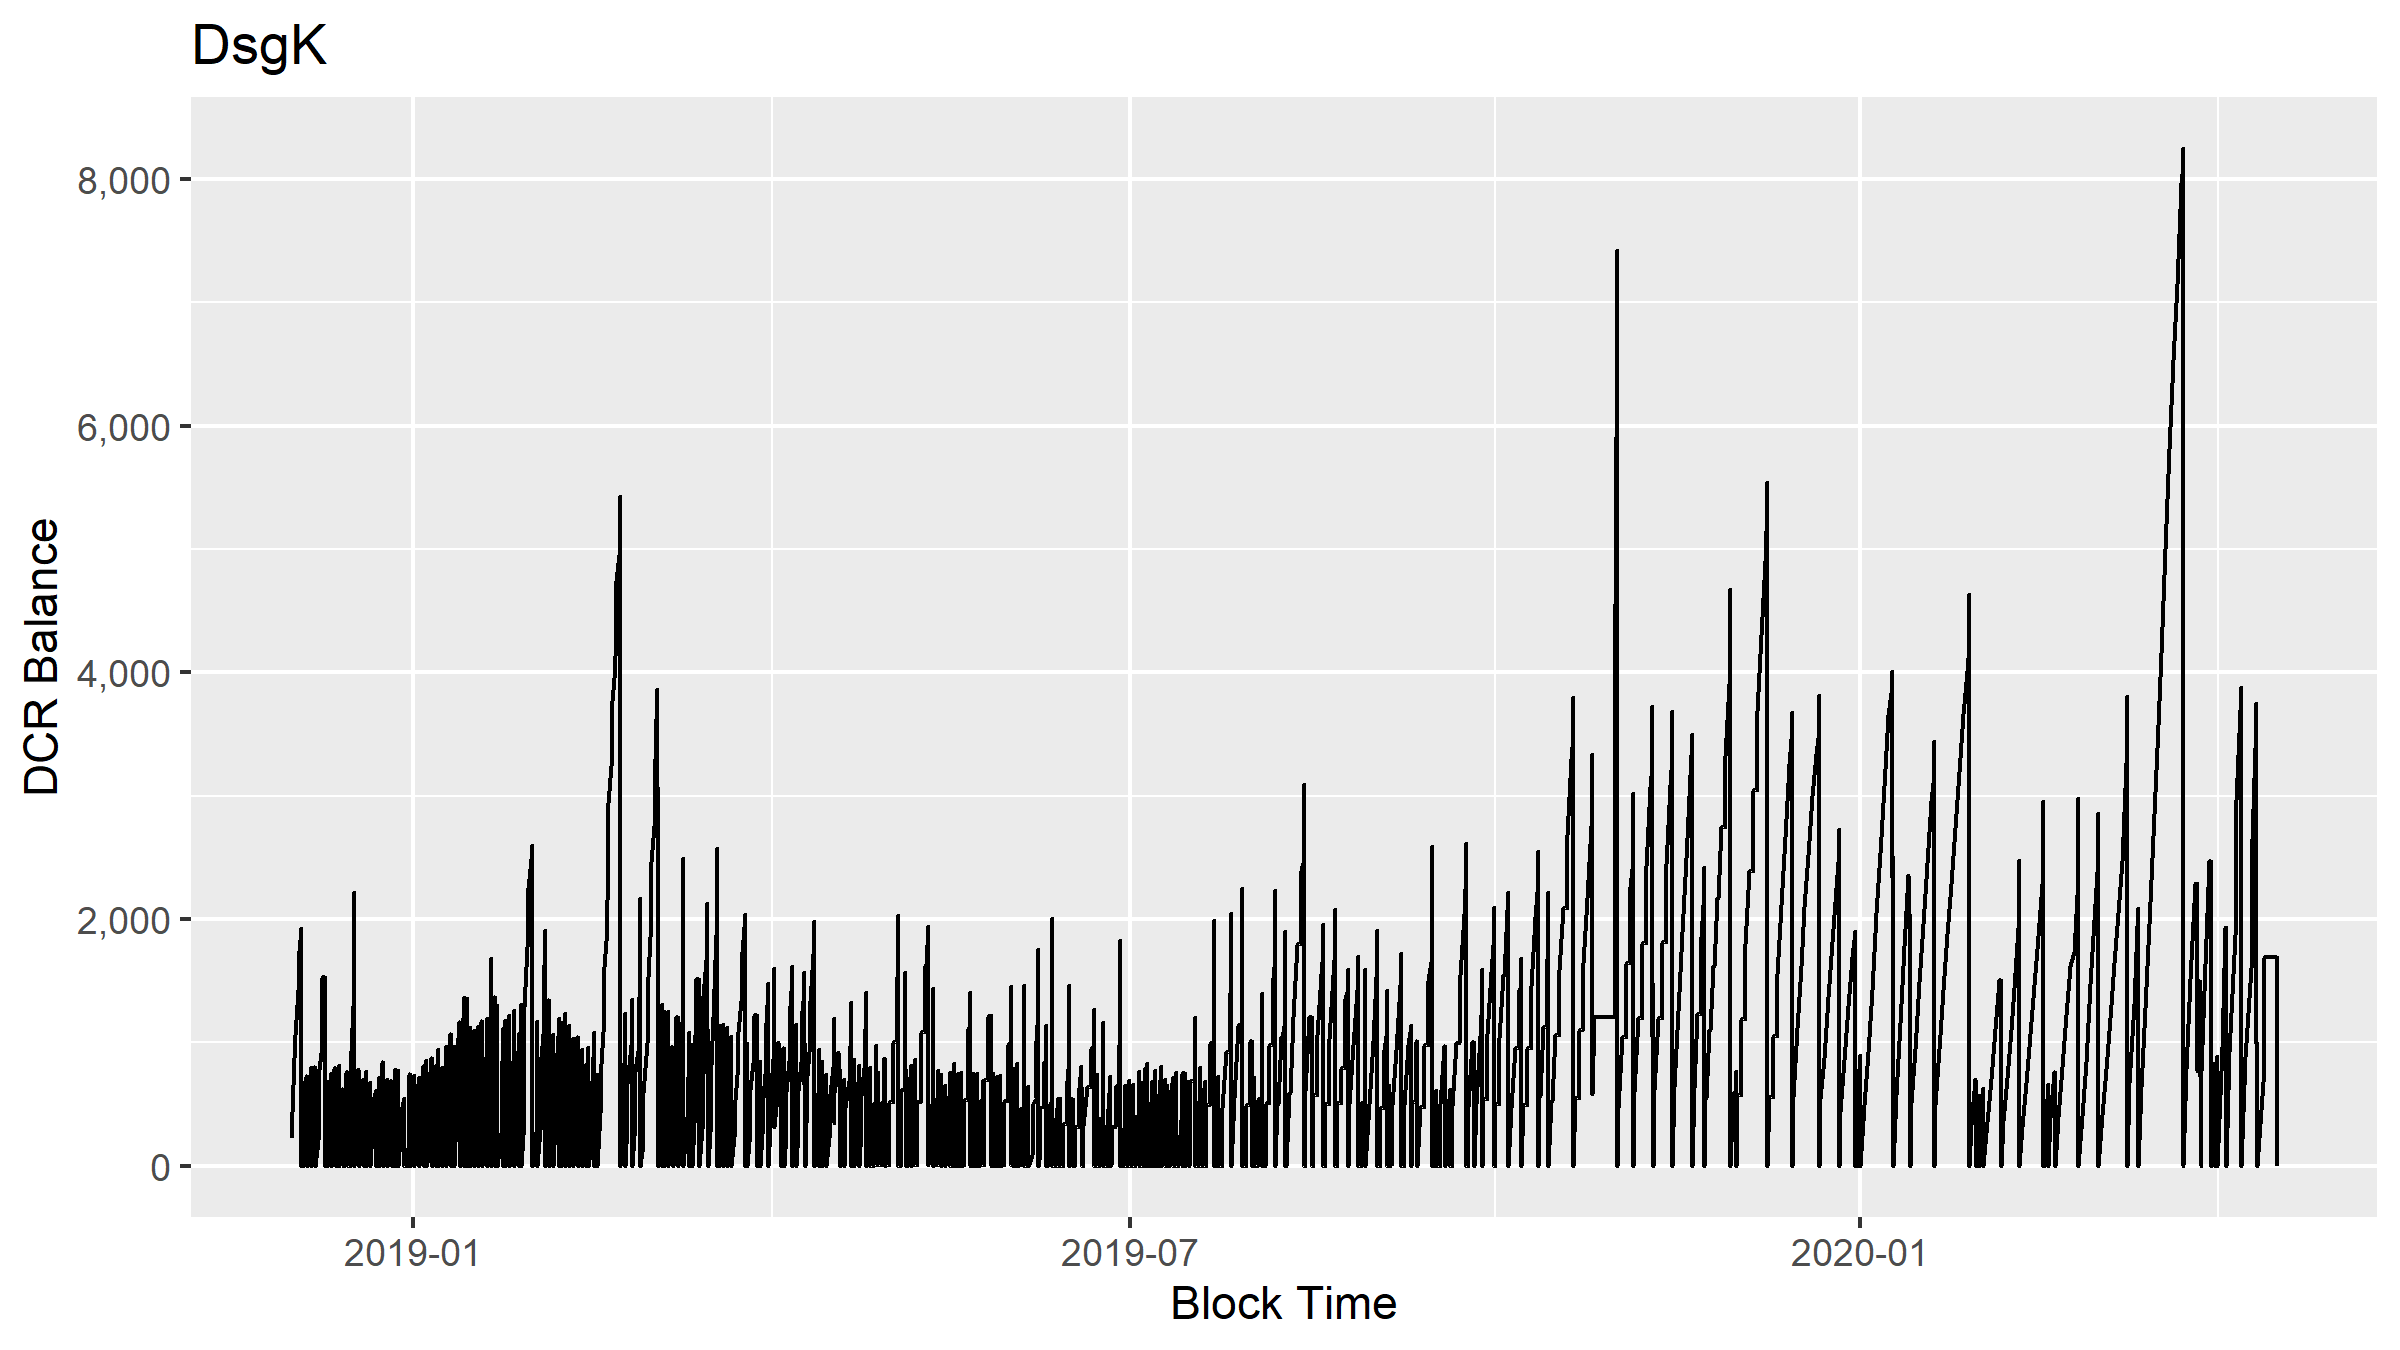
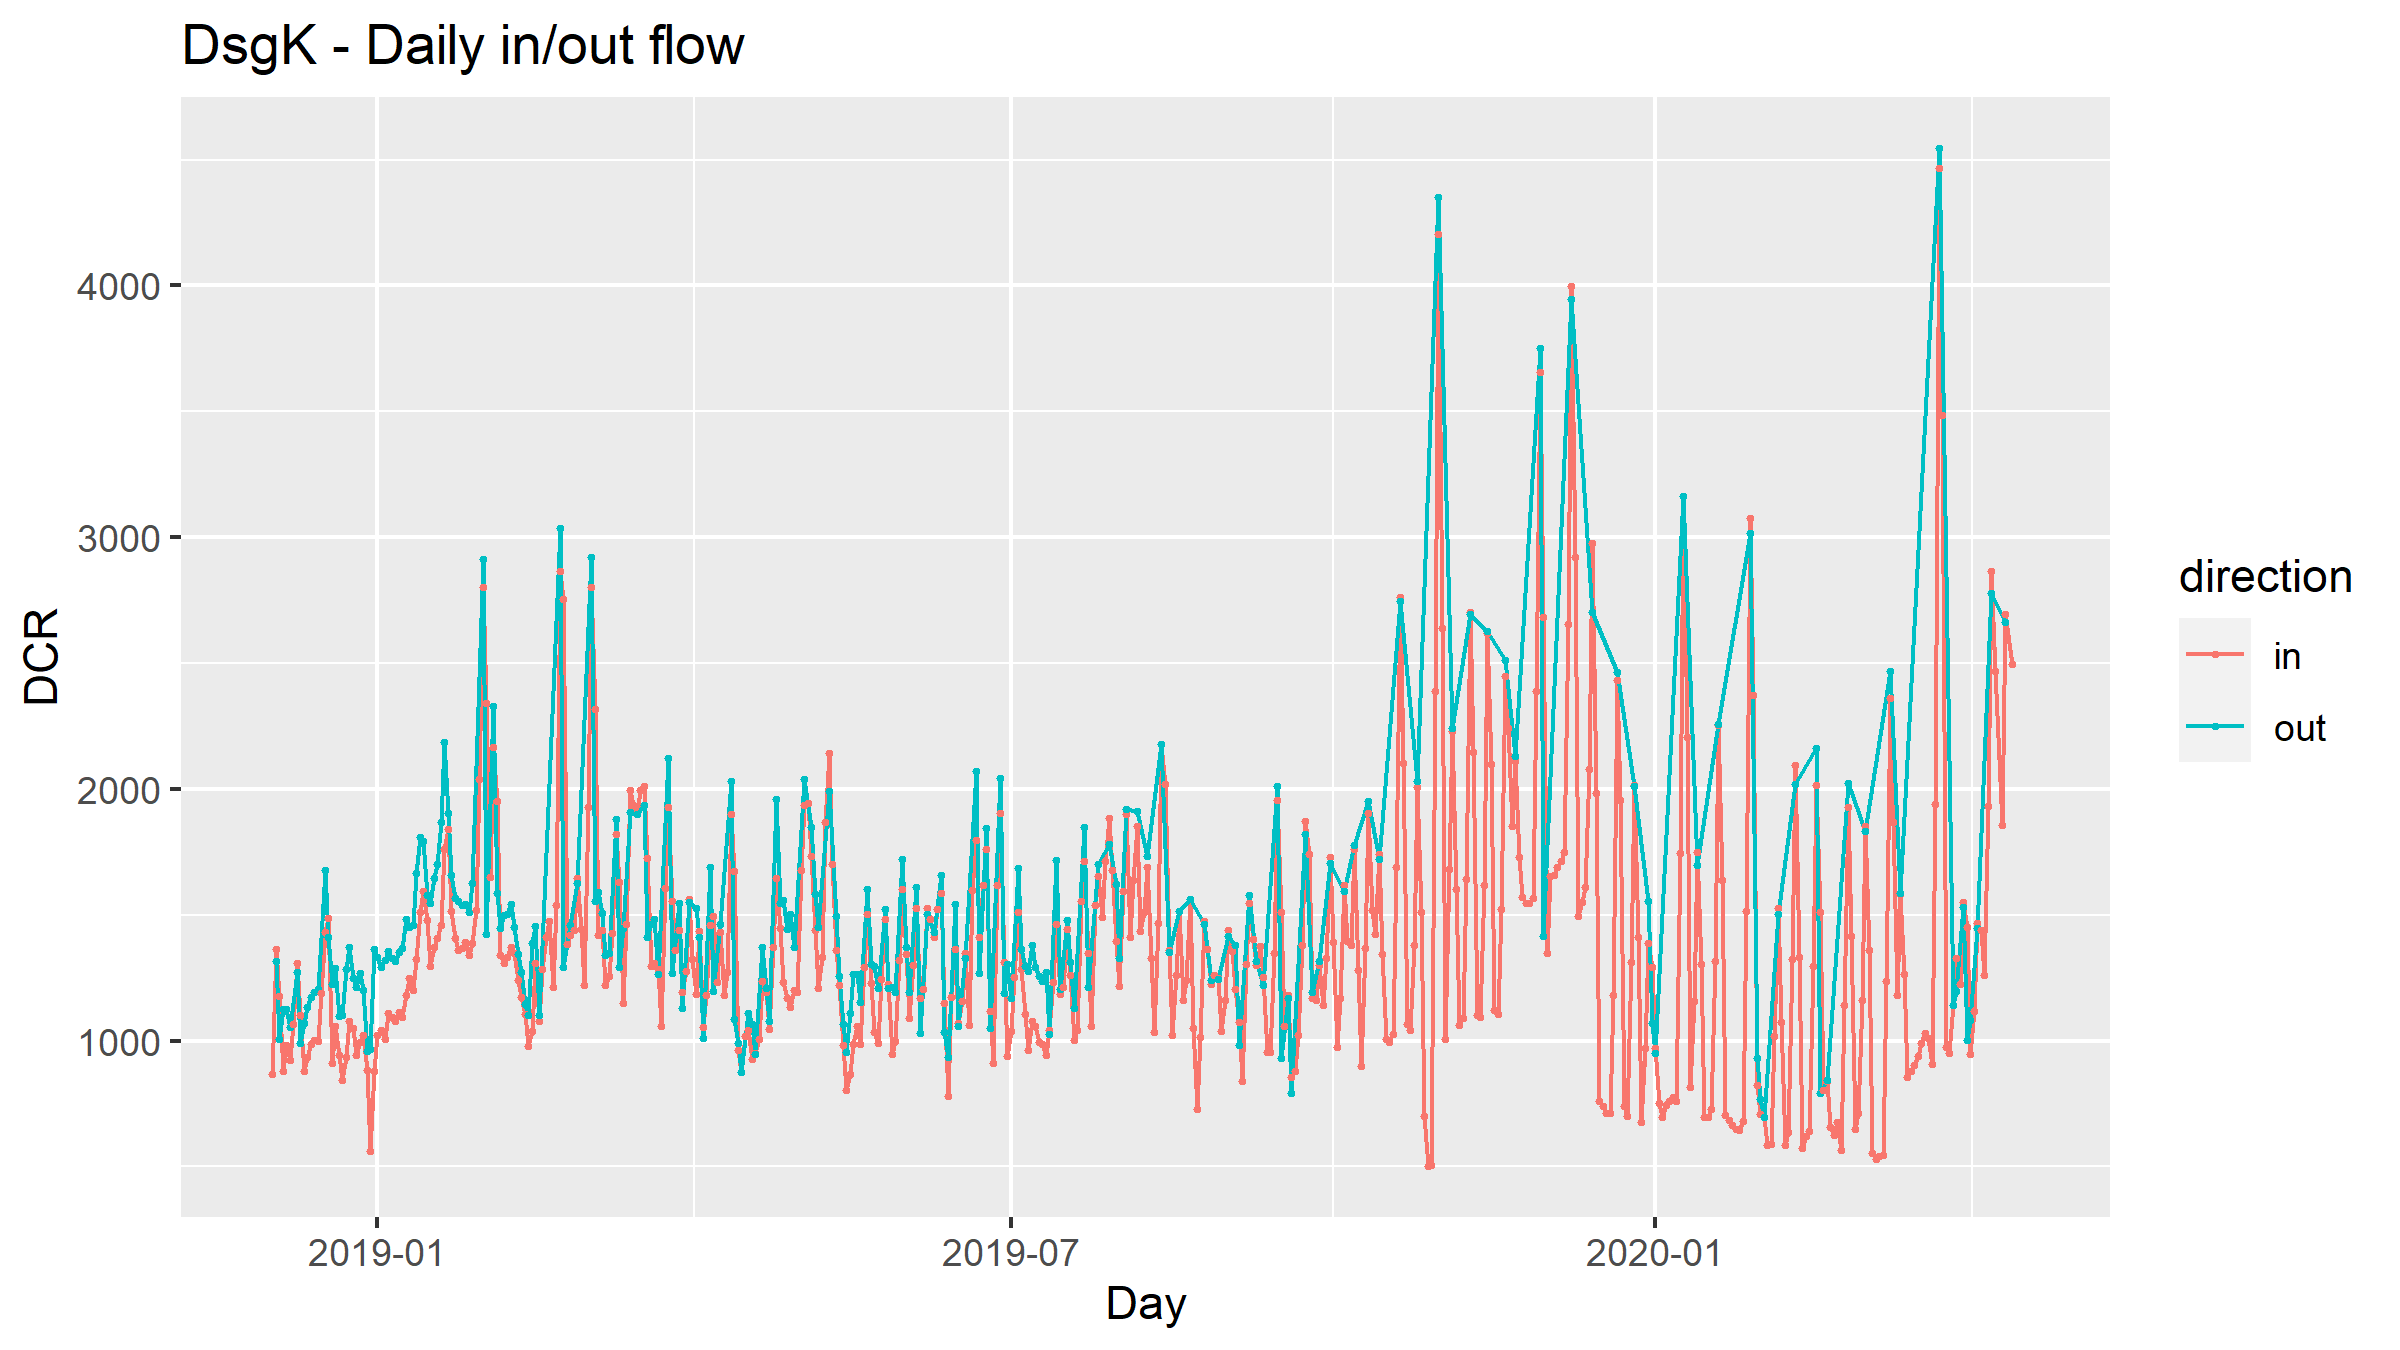
This cluster started up in Dec 2018, it has received 201K DCR at hop 1 from the PoW reward - the original source being the DscM cluster above.
DCR balance of the DsgK cluster
Balance is periodically zeroed out.
DCR flowing to/from the DsgK cluster
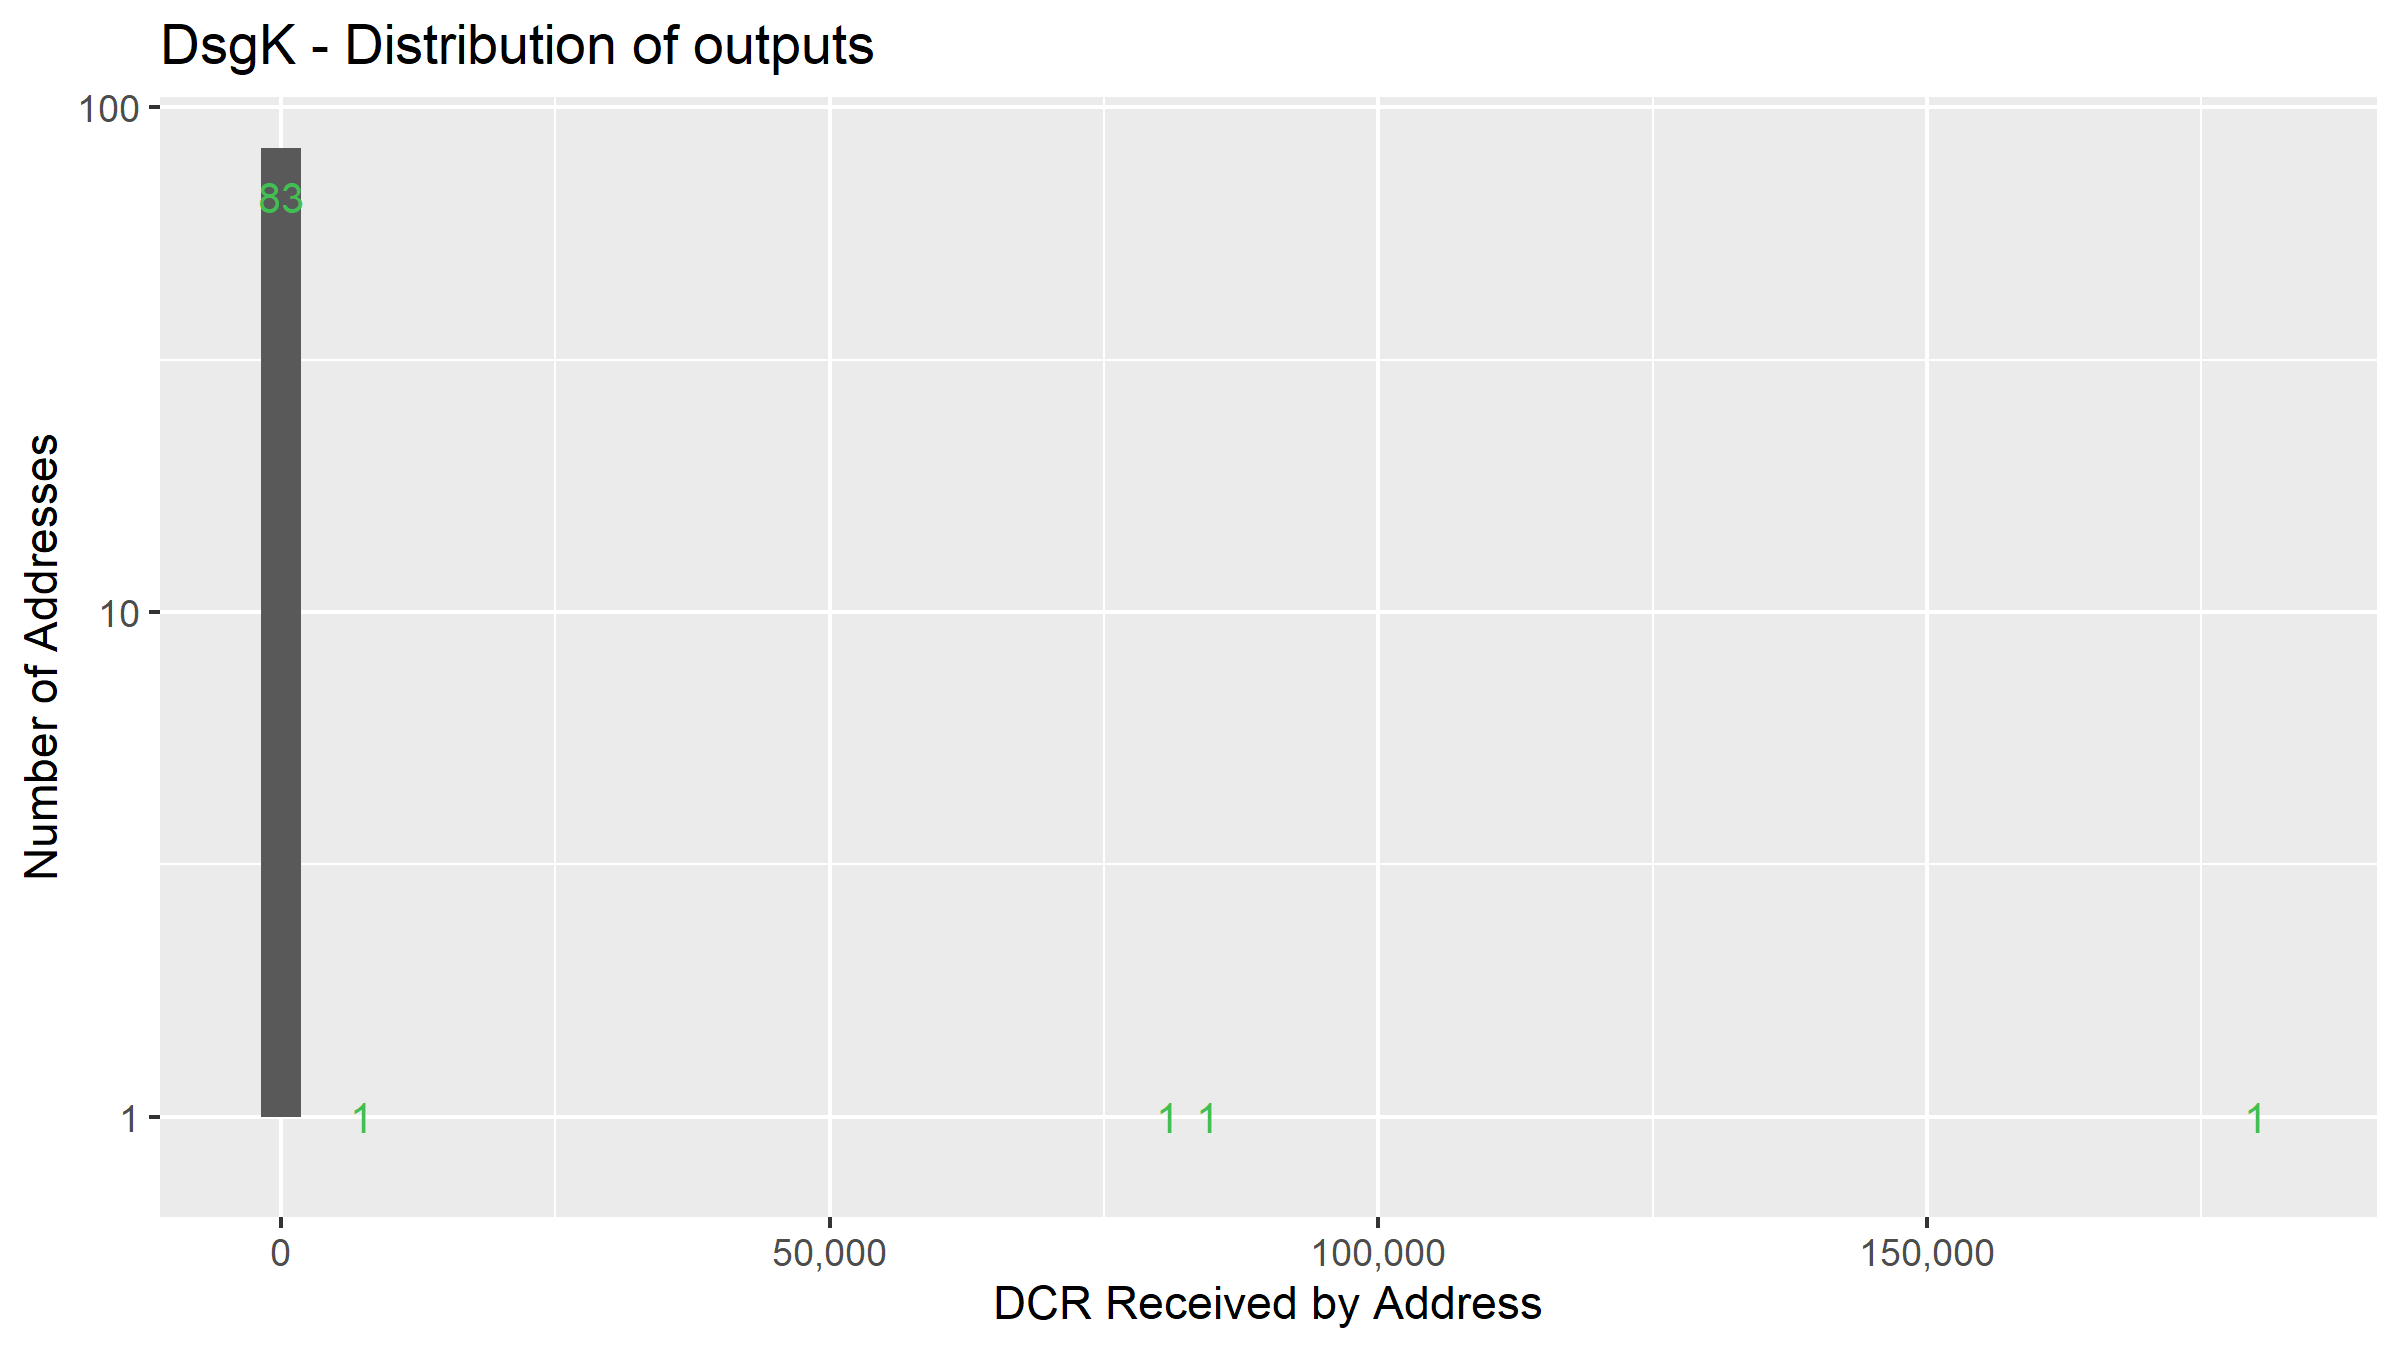
Distribution of outputs for the DsgK cluster
Most of the DCR is going to one address, and it’s not an address which matches any known exchanges. In this case we could assume that the miner sends from one wallet to another which they also control, and follow the DCR from that address onwards. This is the kind of judgement call I will be making when I build up the more complete history of the Decred chain, and by looking at how the clusters interact it should be possible to explain much more of the motivations behind the transactions.
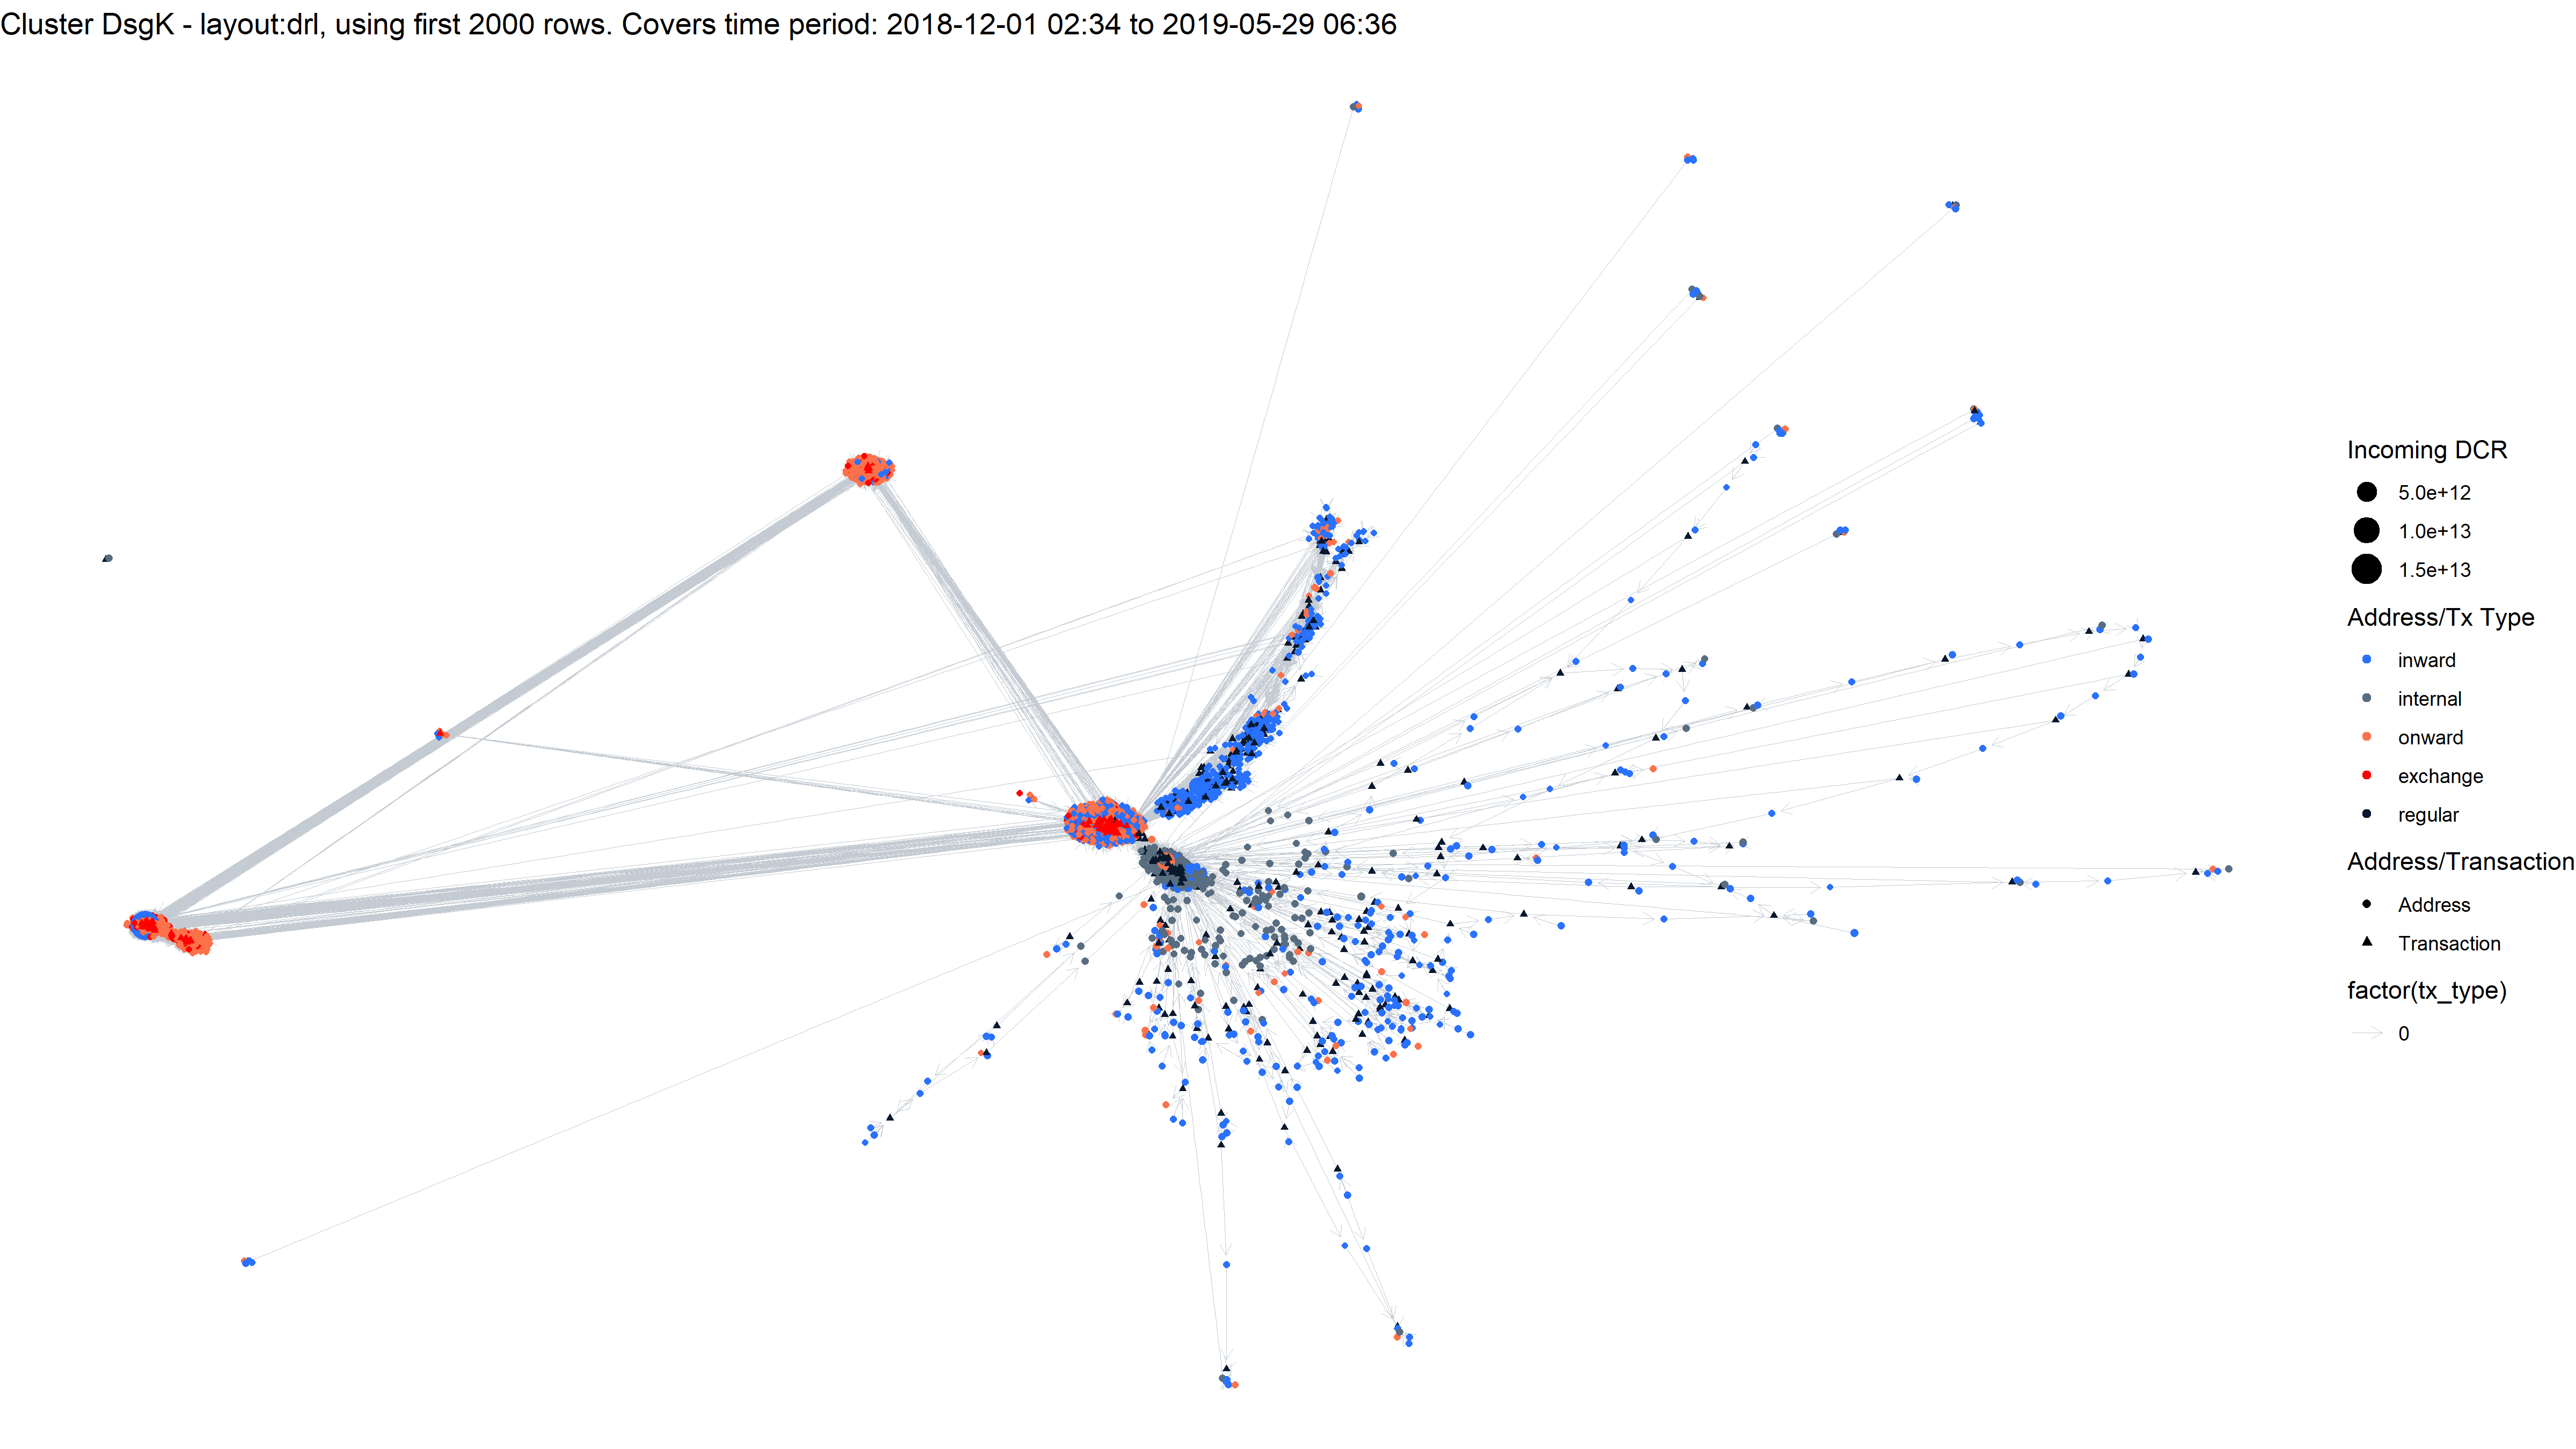
Network visualization for DsgK cluster
4 - DsVy
This cluster started up in Feb 2019 and has received 191K DCR at hop 1 - coming from the Dsju mining cluster above.
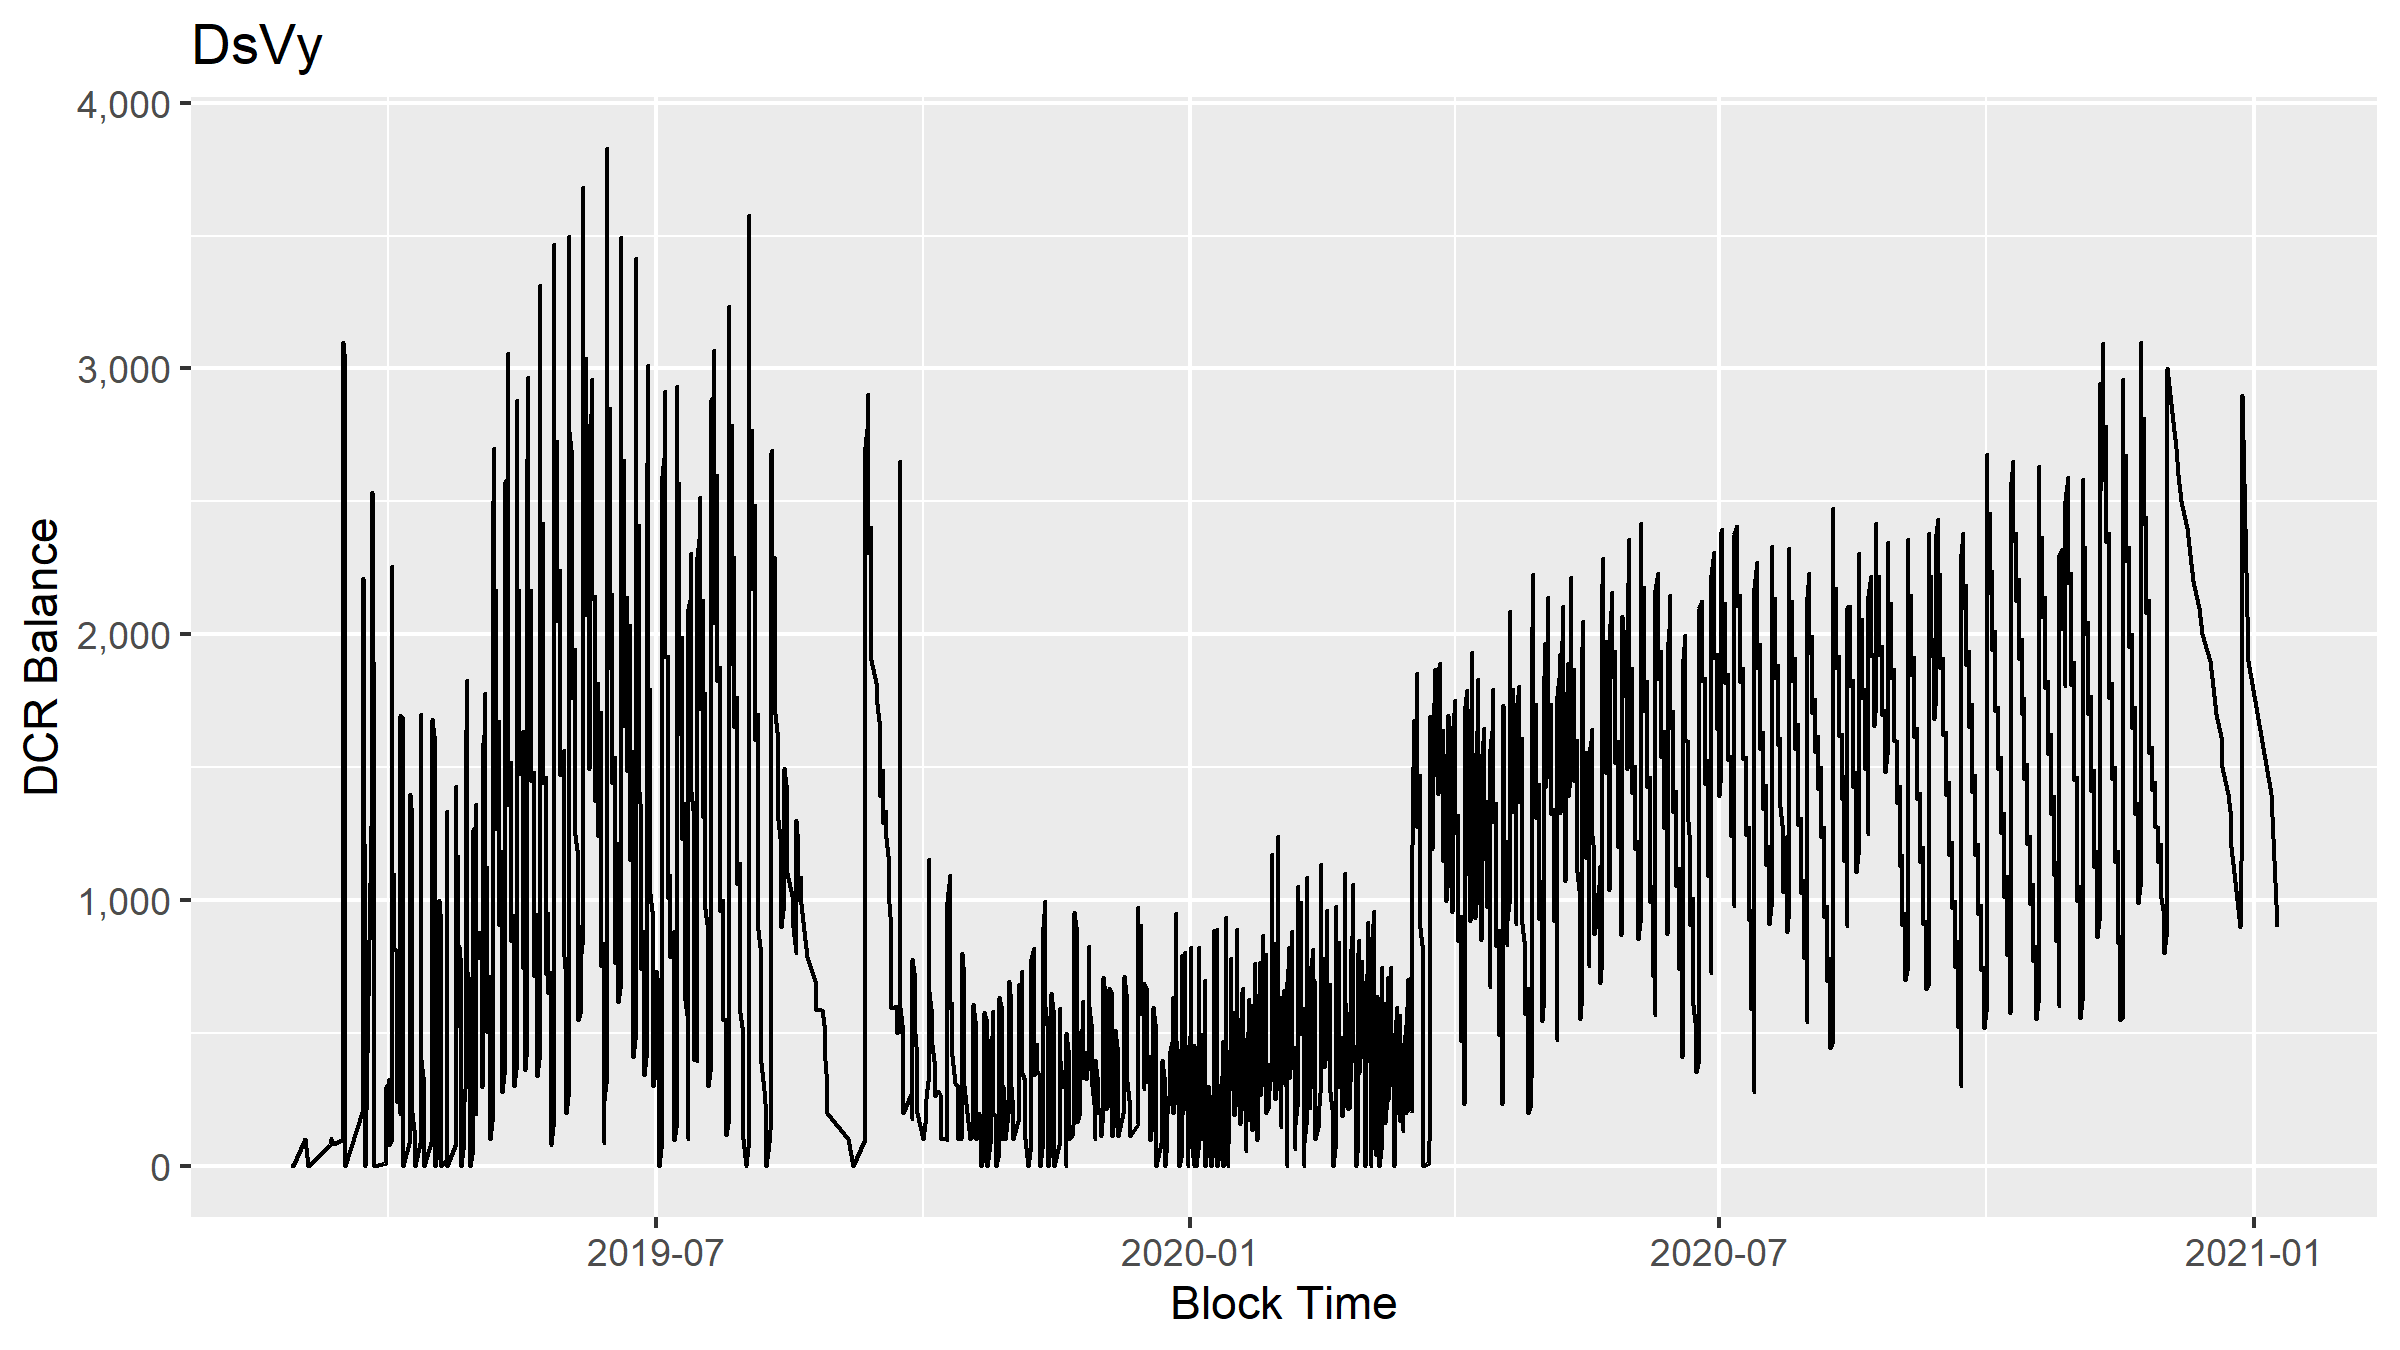
DCR balance of the DsVy cluster
Balance is allowed to grow to the hundreds or low thousands before most of it is transferred out.

DCR flowing to/from the DsVy cluster
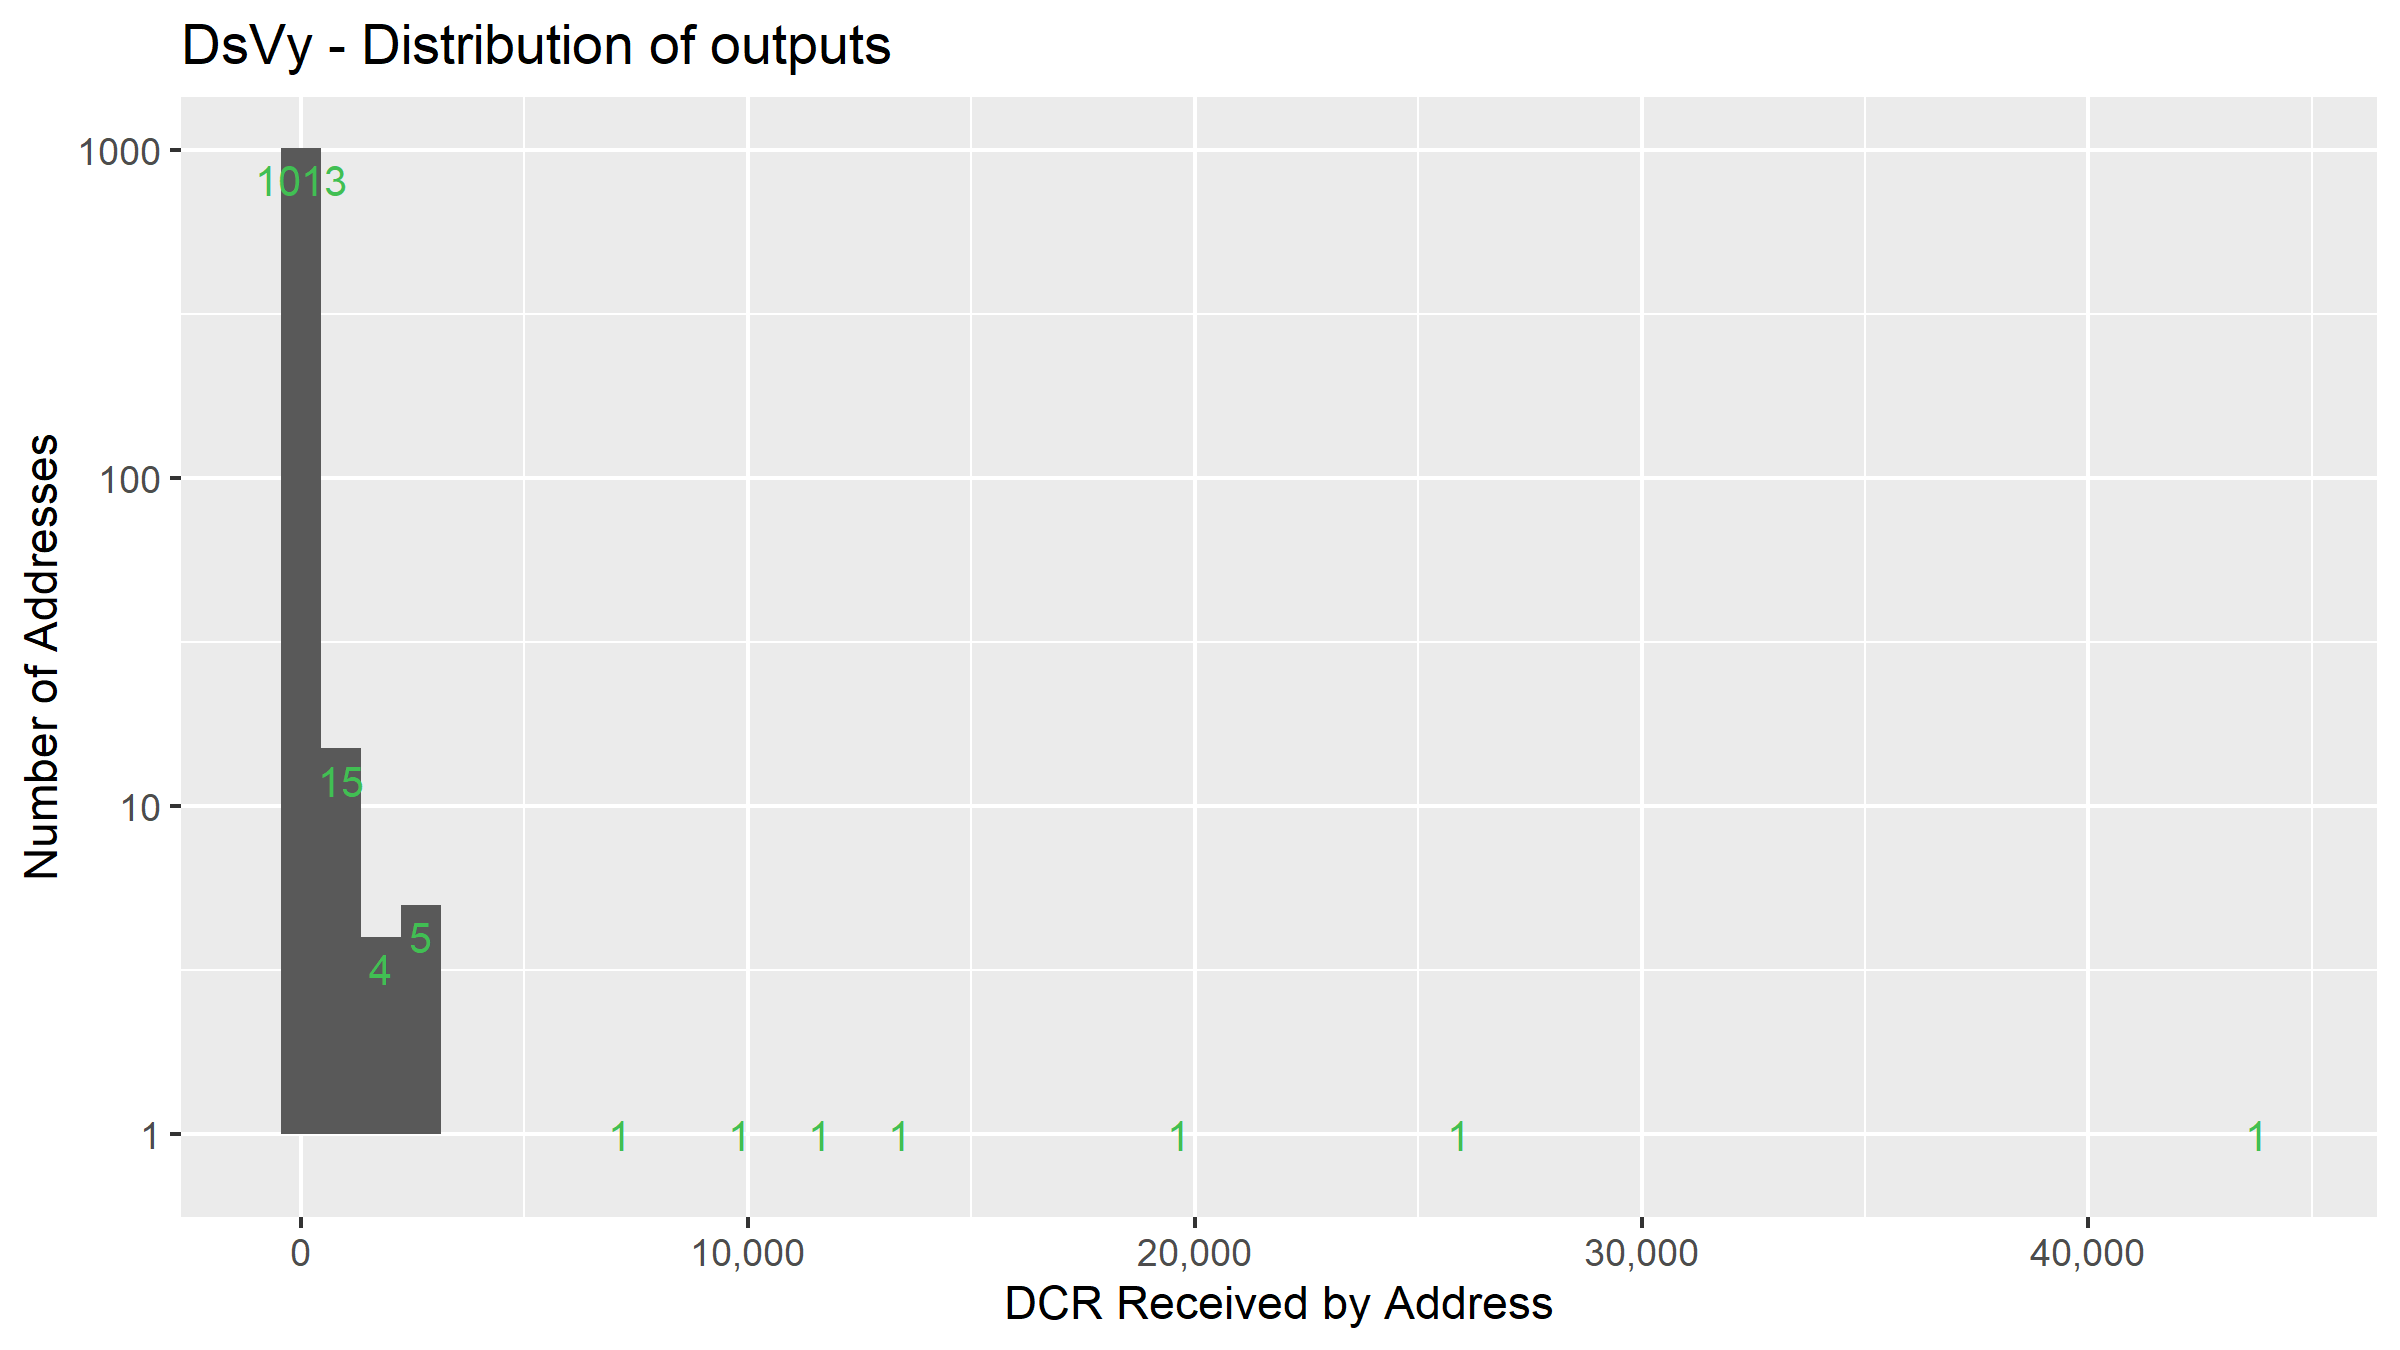
Distribution of outputs for the DsVy cluster
33K of this cluster’s DCR outputs went to Binance, 143 DCR to Bitrex and 231 DCR to Poloniex. This cluster looks like a pool making payouts to miners, but could conceivably be an individual’s wallet.
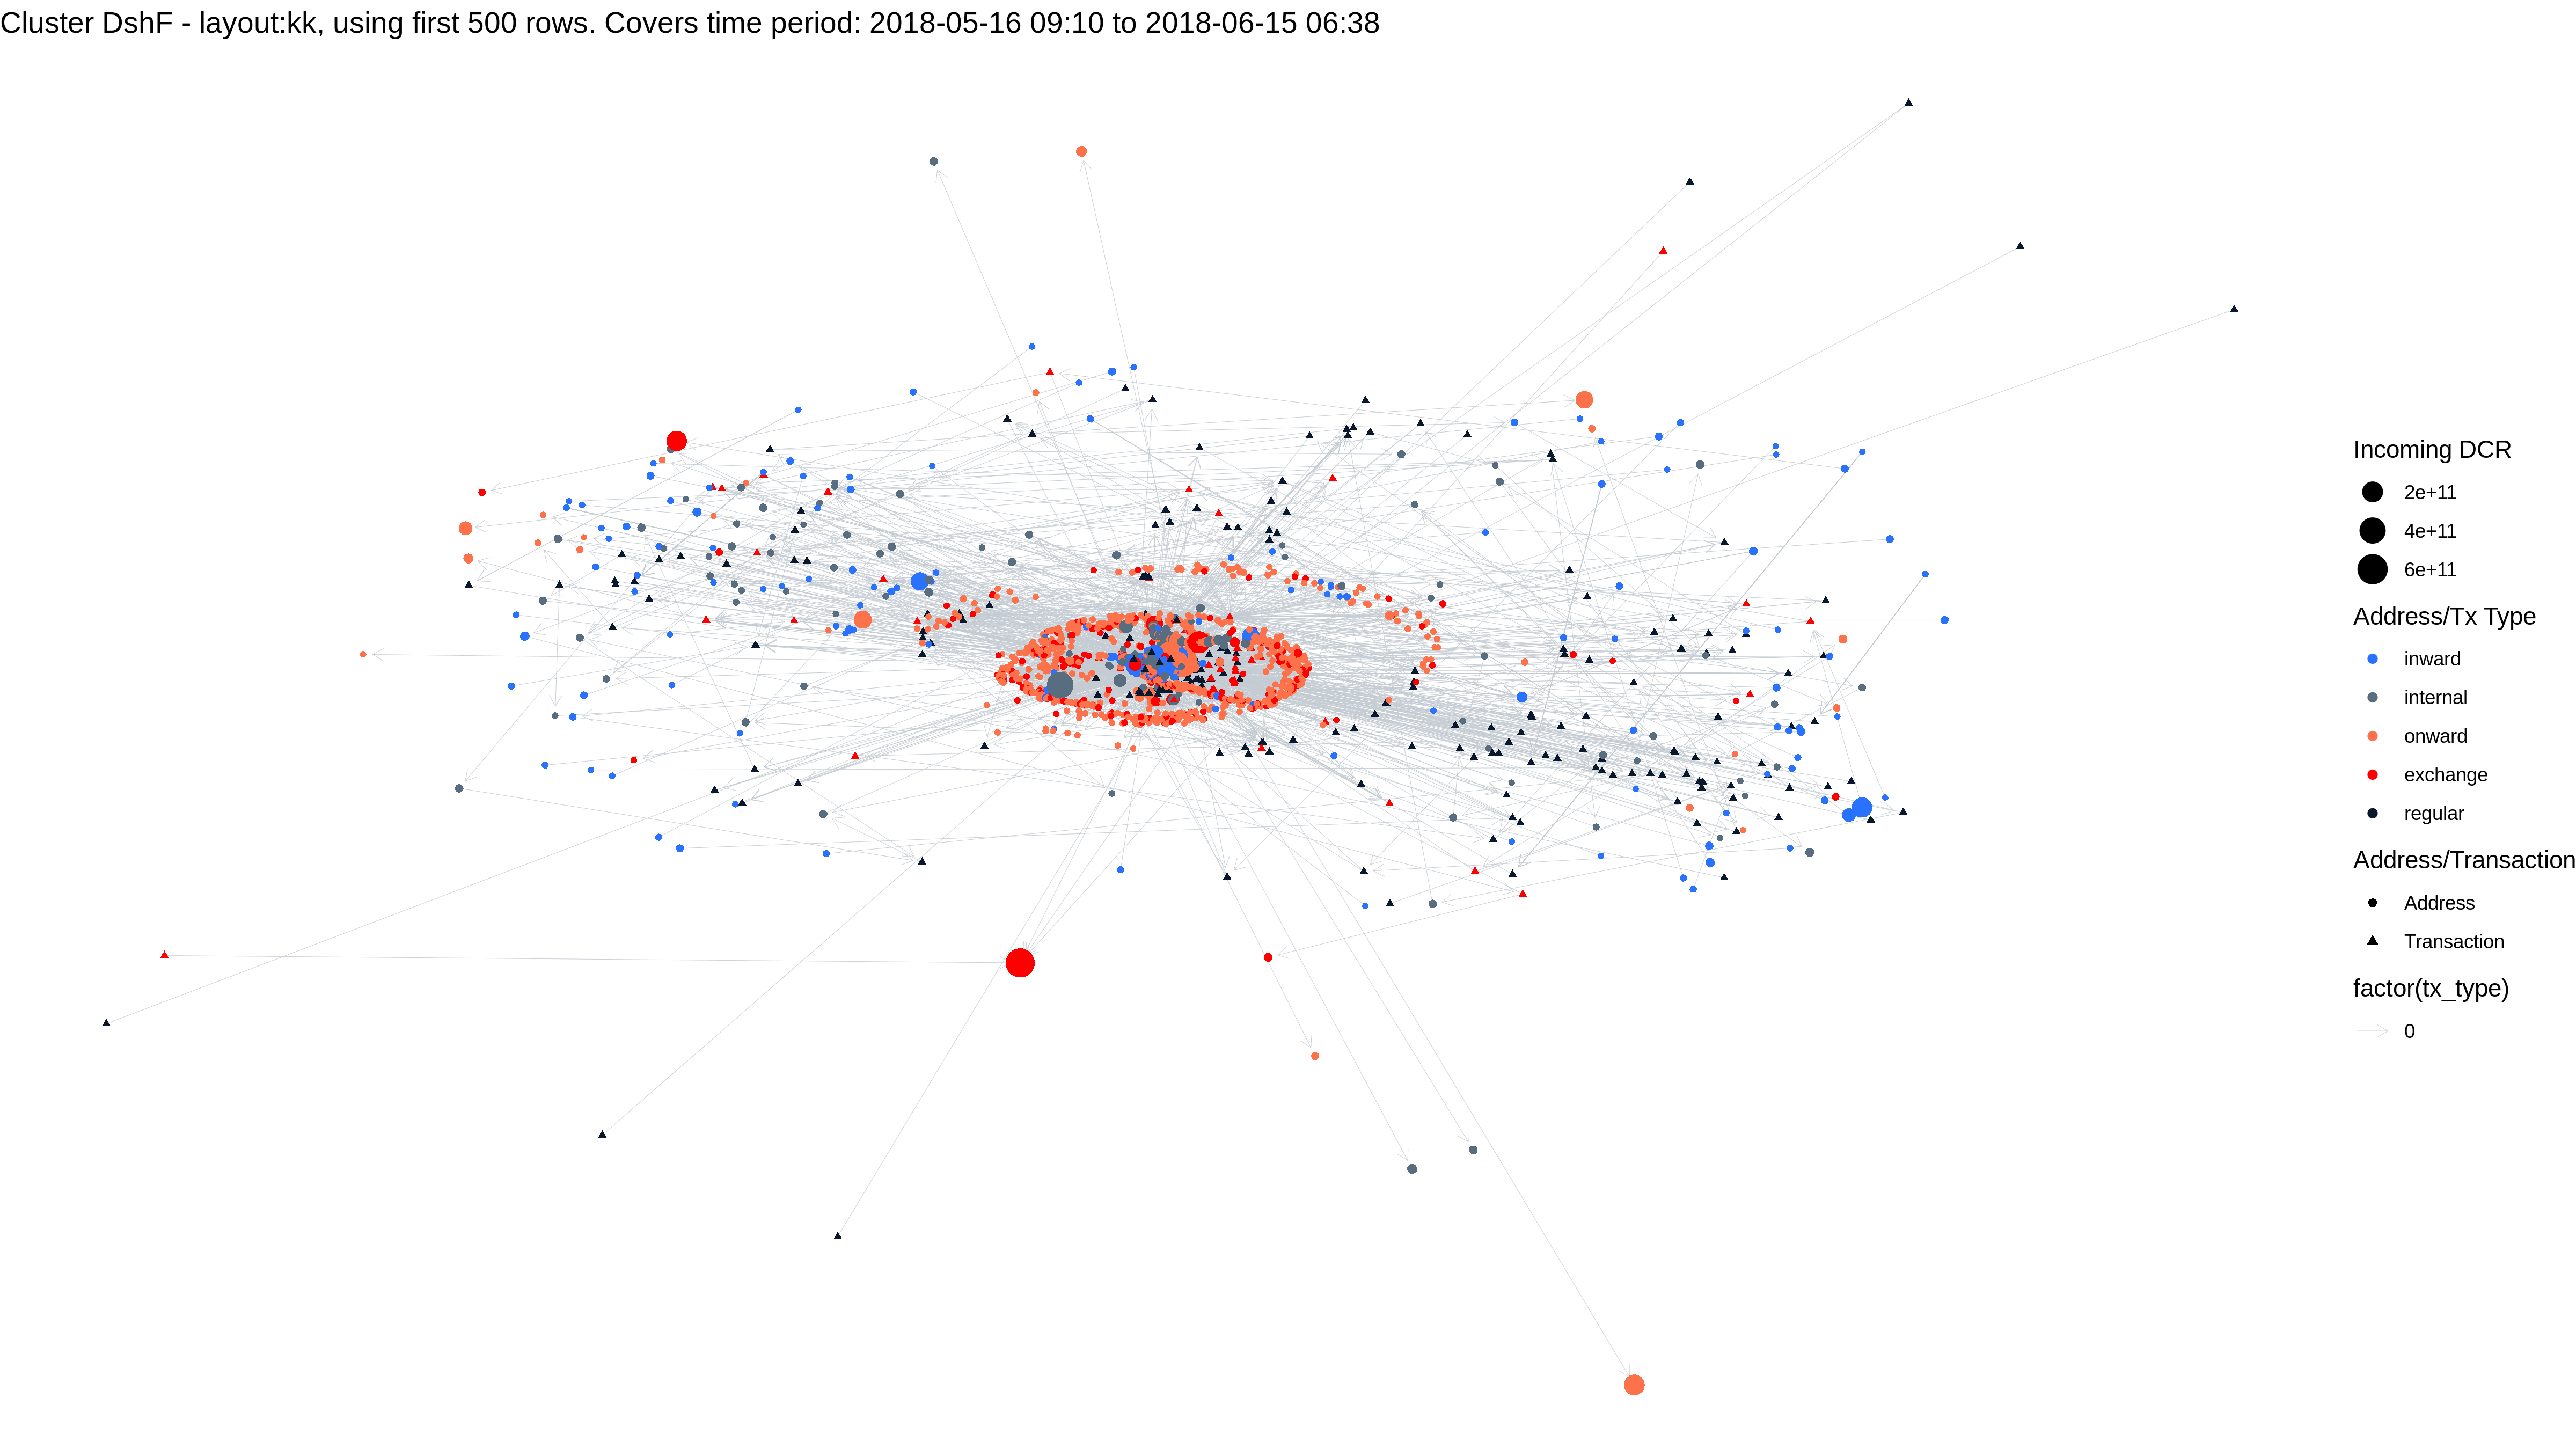
Network visualization for DshF cluster
5 - DsgR
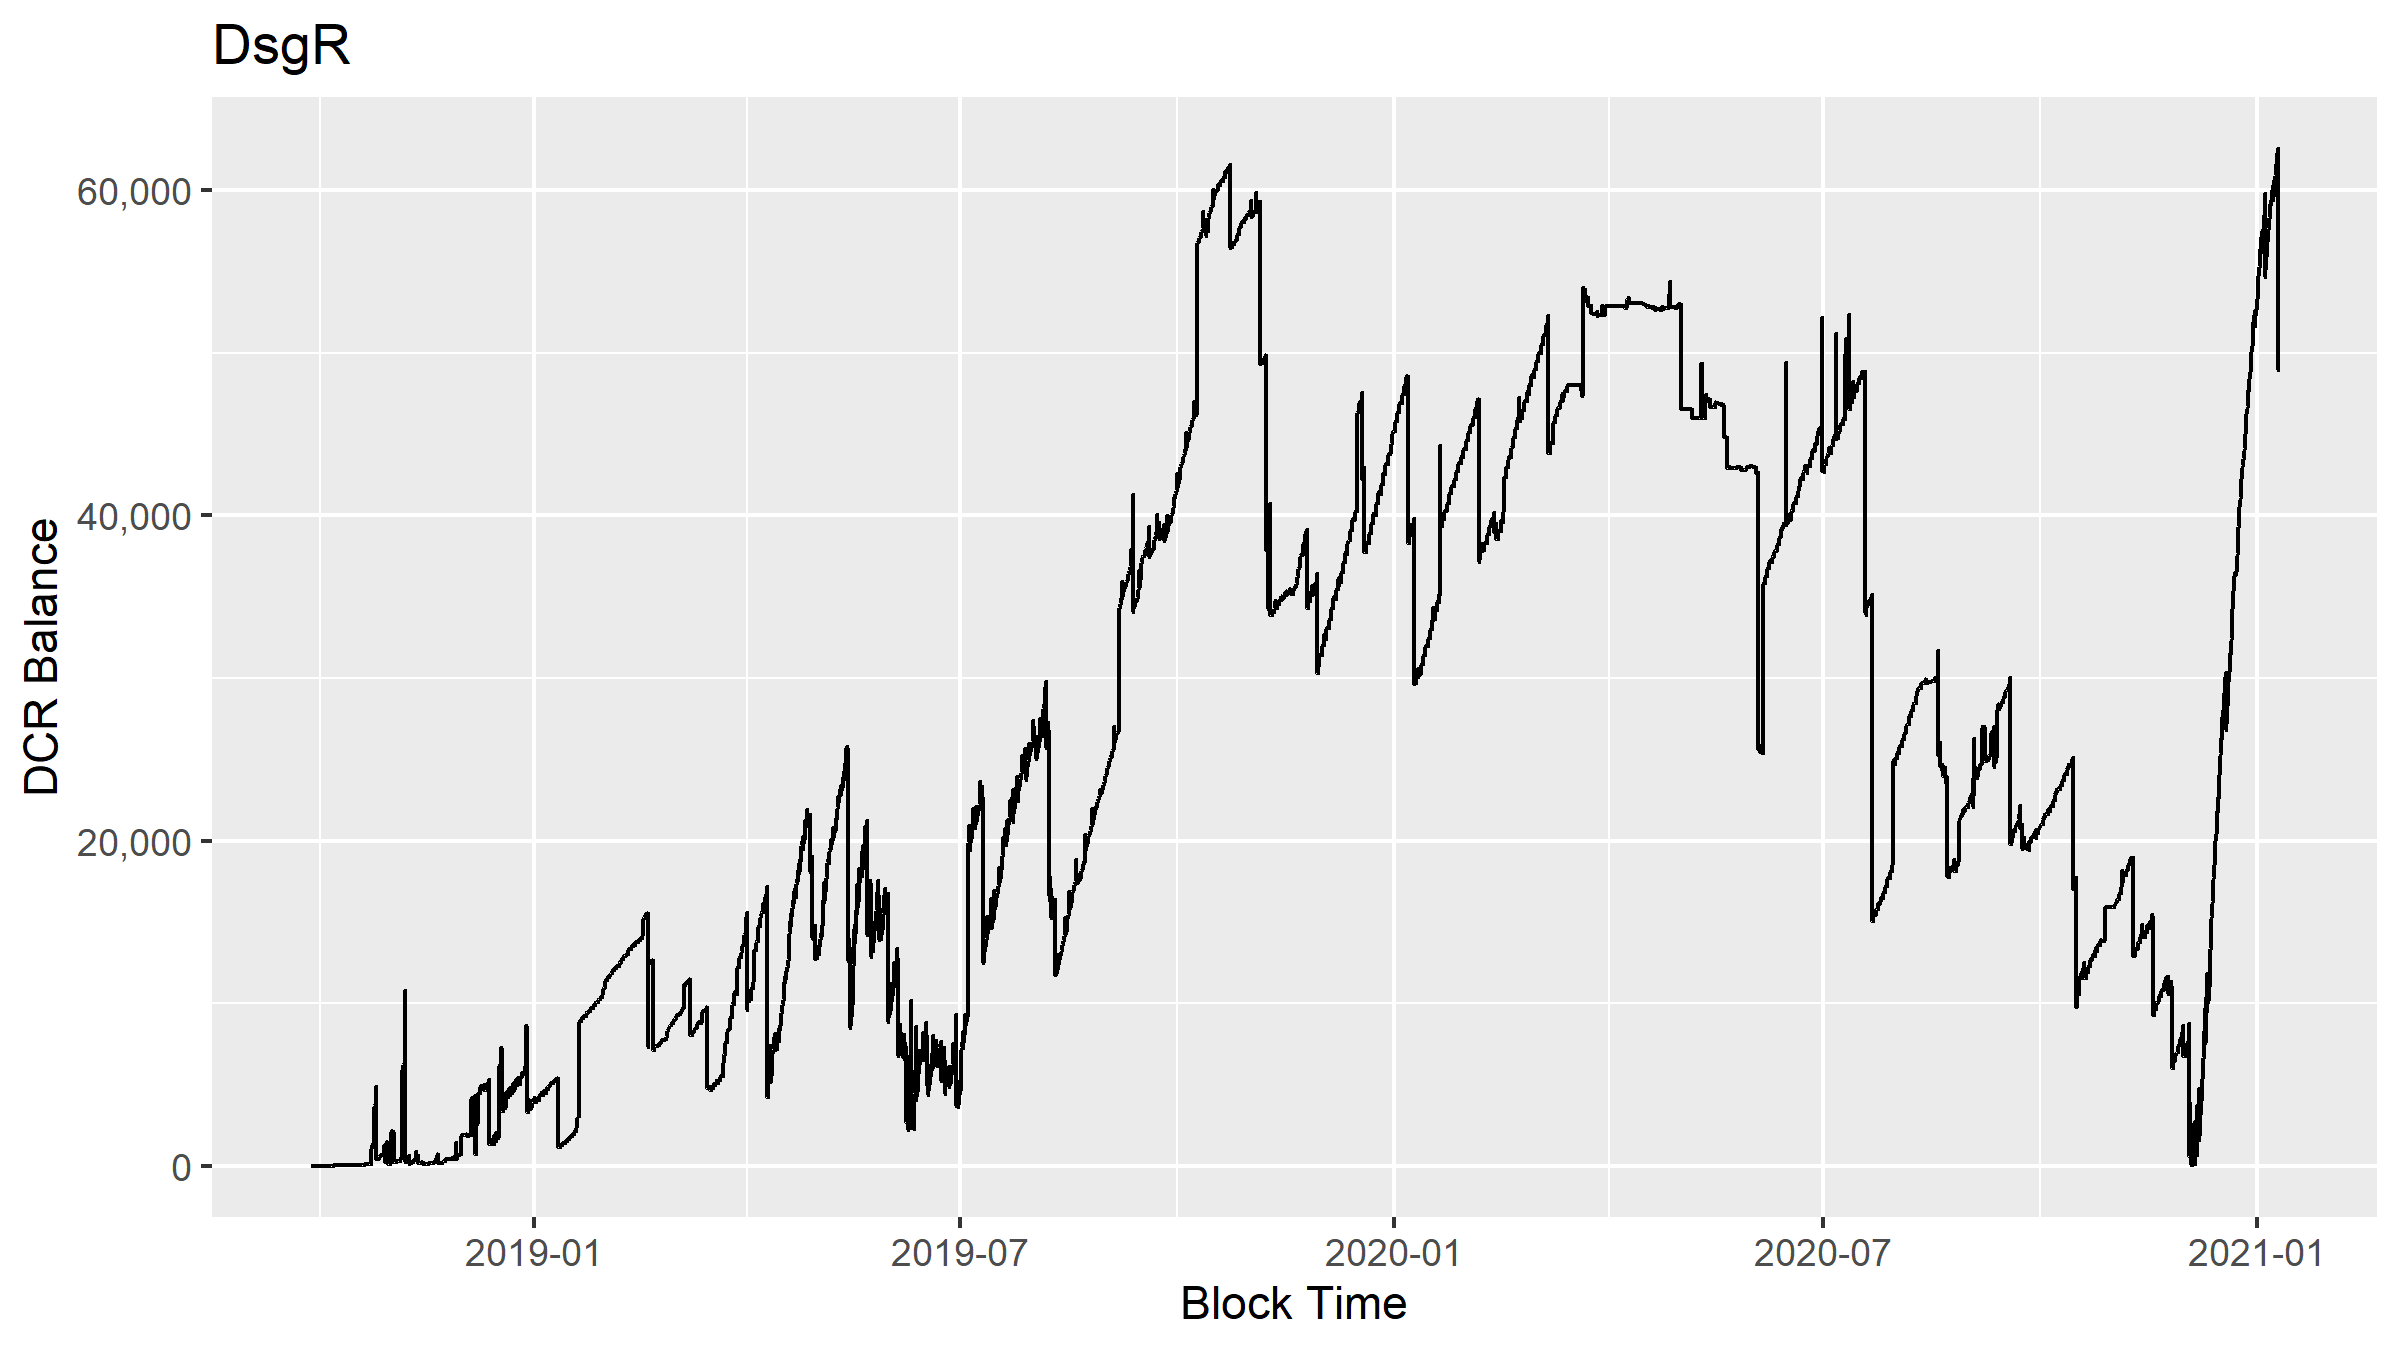
This cluster started up in September 2018, it has 141K DCR at hop 1 from PoW rewards, but it also mined 10,877 blocks directly and claimed 112K DCR for doing so.
DCR balance of the DsgR cluster
This cluster retains a significant balance, which suggests it is more likely to represent an individual’s holdings. The cluster also appears to receive significant sums of DCR from sources other than mining, but the only hit I got for the source of this is 10 DCR which travelled 2 hops from a Treasury payout.
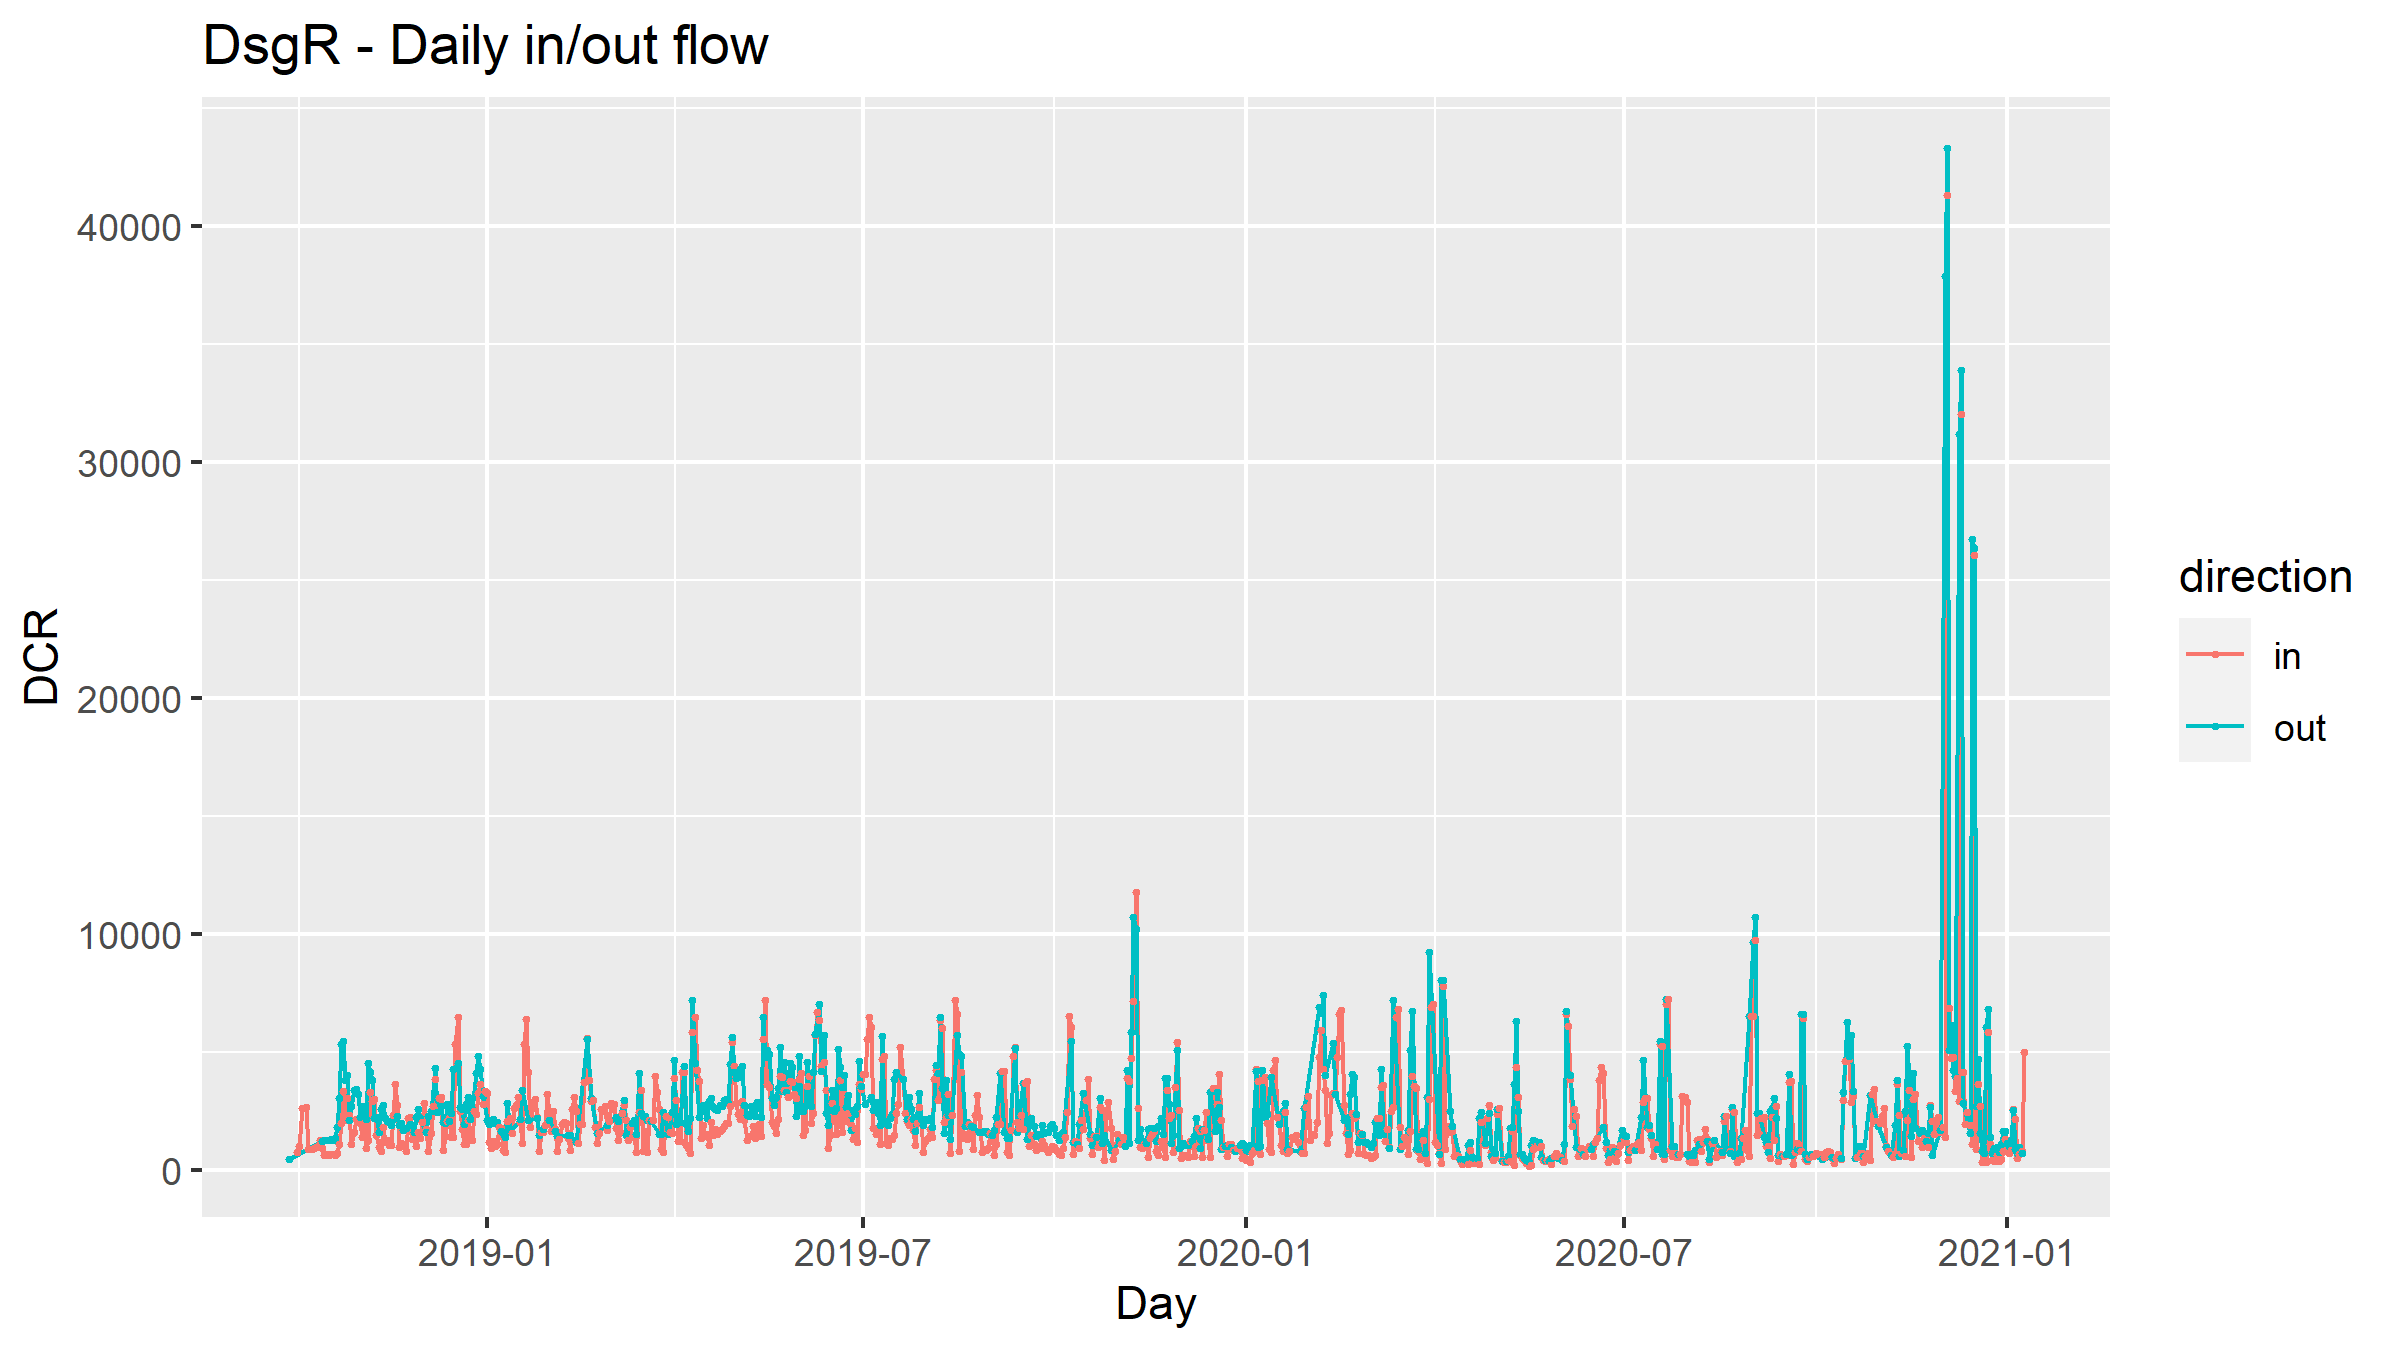
DCR flowing to/from the DsgR cluster
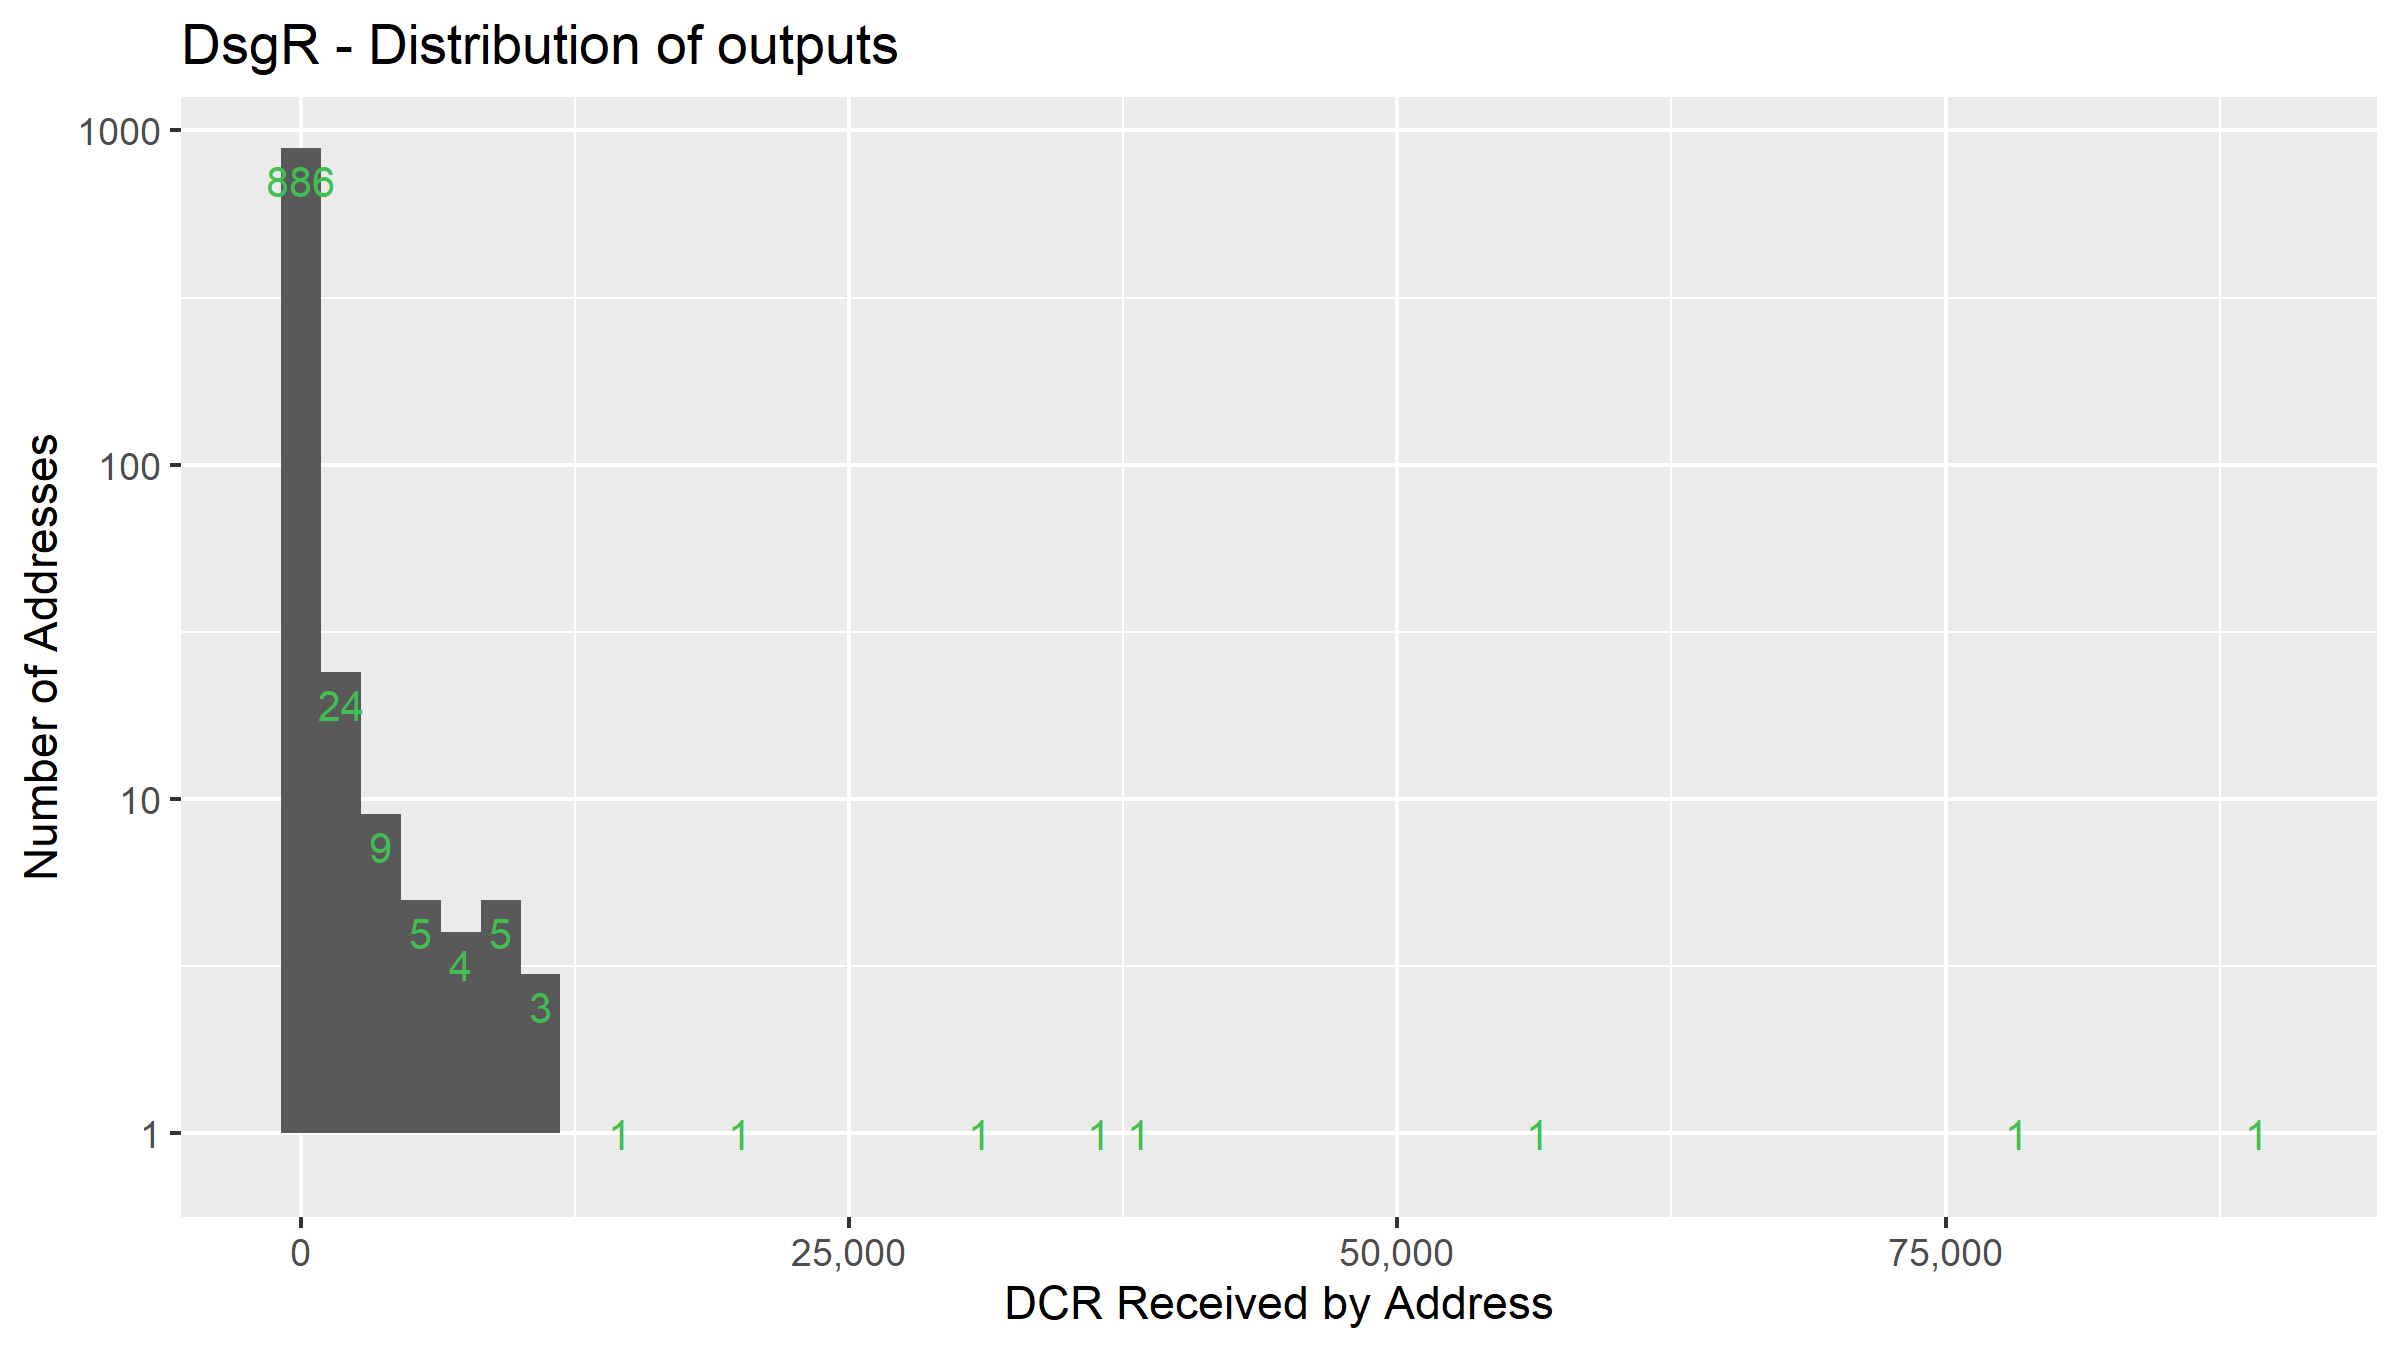
Distribution of outputs for the DsgR cluster
The output addresses for this cluster include Binance (131K DCR), Bittrex (2.3K DCR) and Poloniex (6 DCR).

Network visualization for DsgR cluster
Miners at the Exchange
In addition to this view based on clustering miner addresses, I have looked at PoW rewards from an exchange perspective also - specifically Binance. I’m pretty sure this captures all PoW sent from miners to Binance.
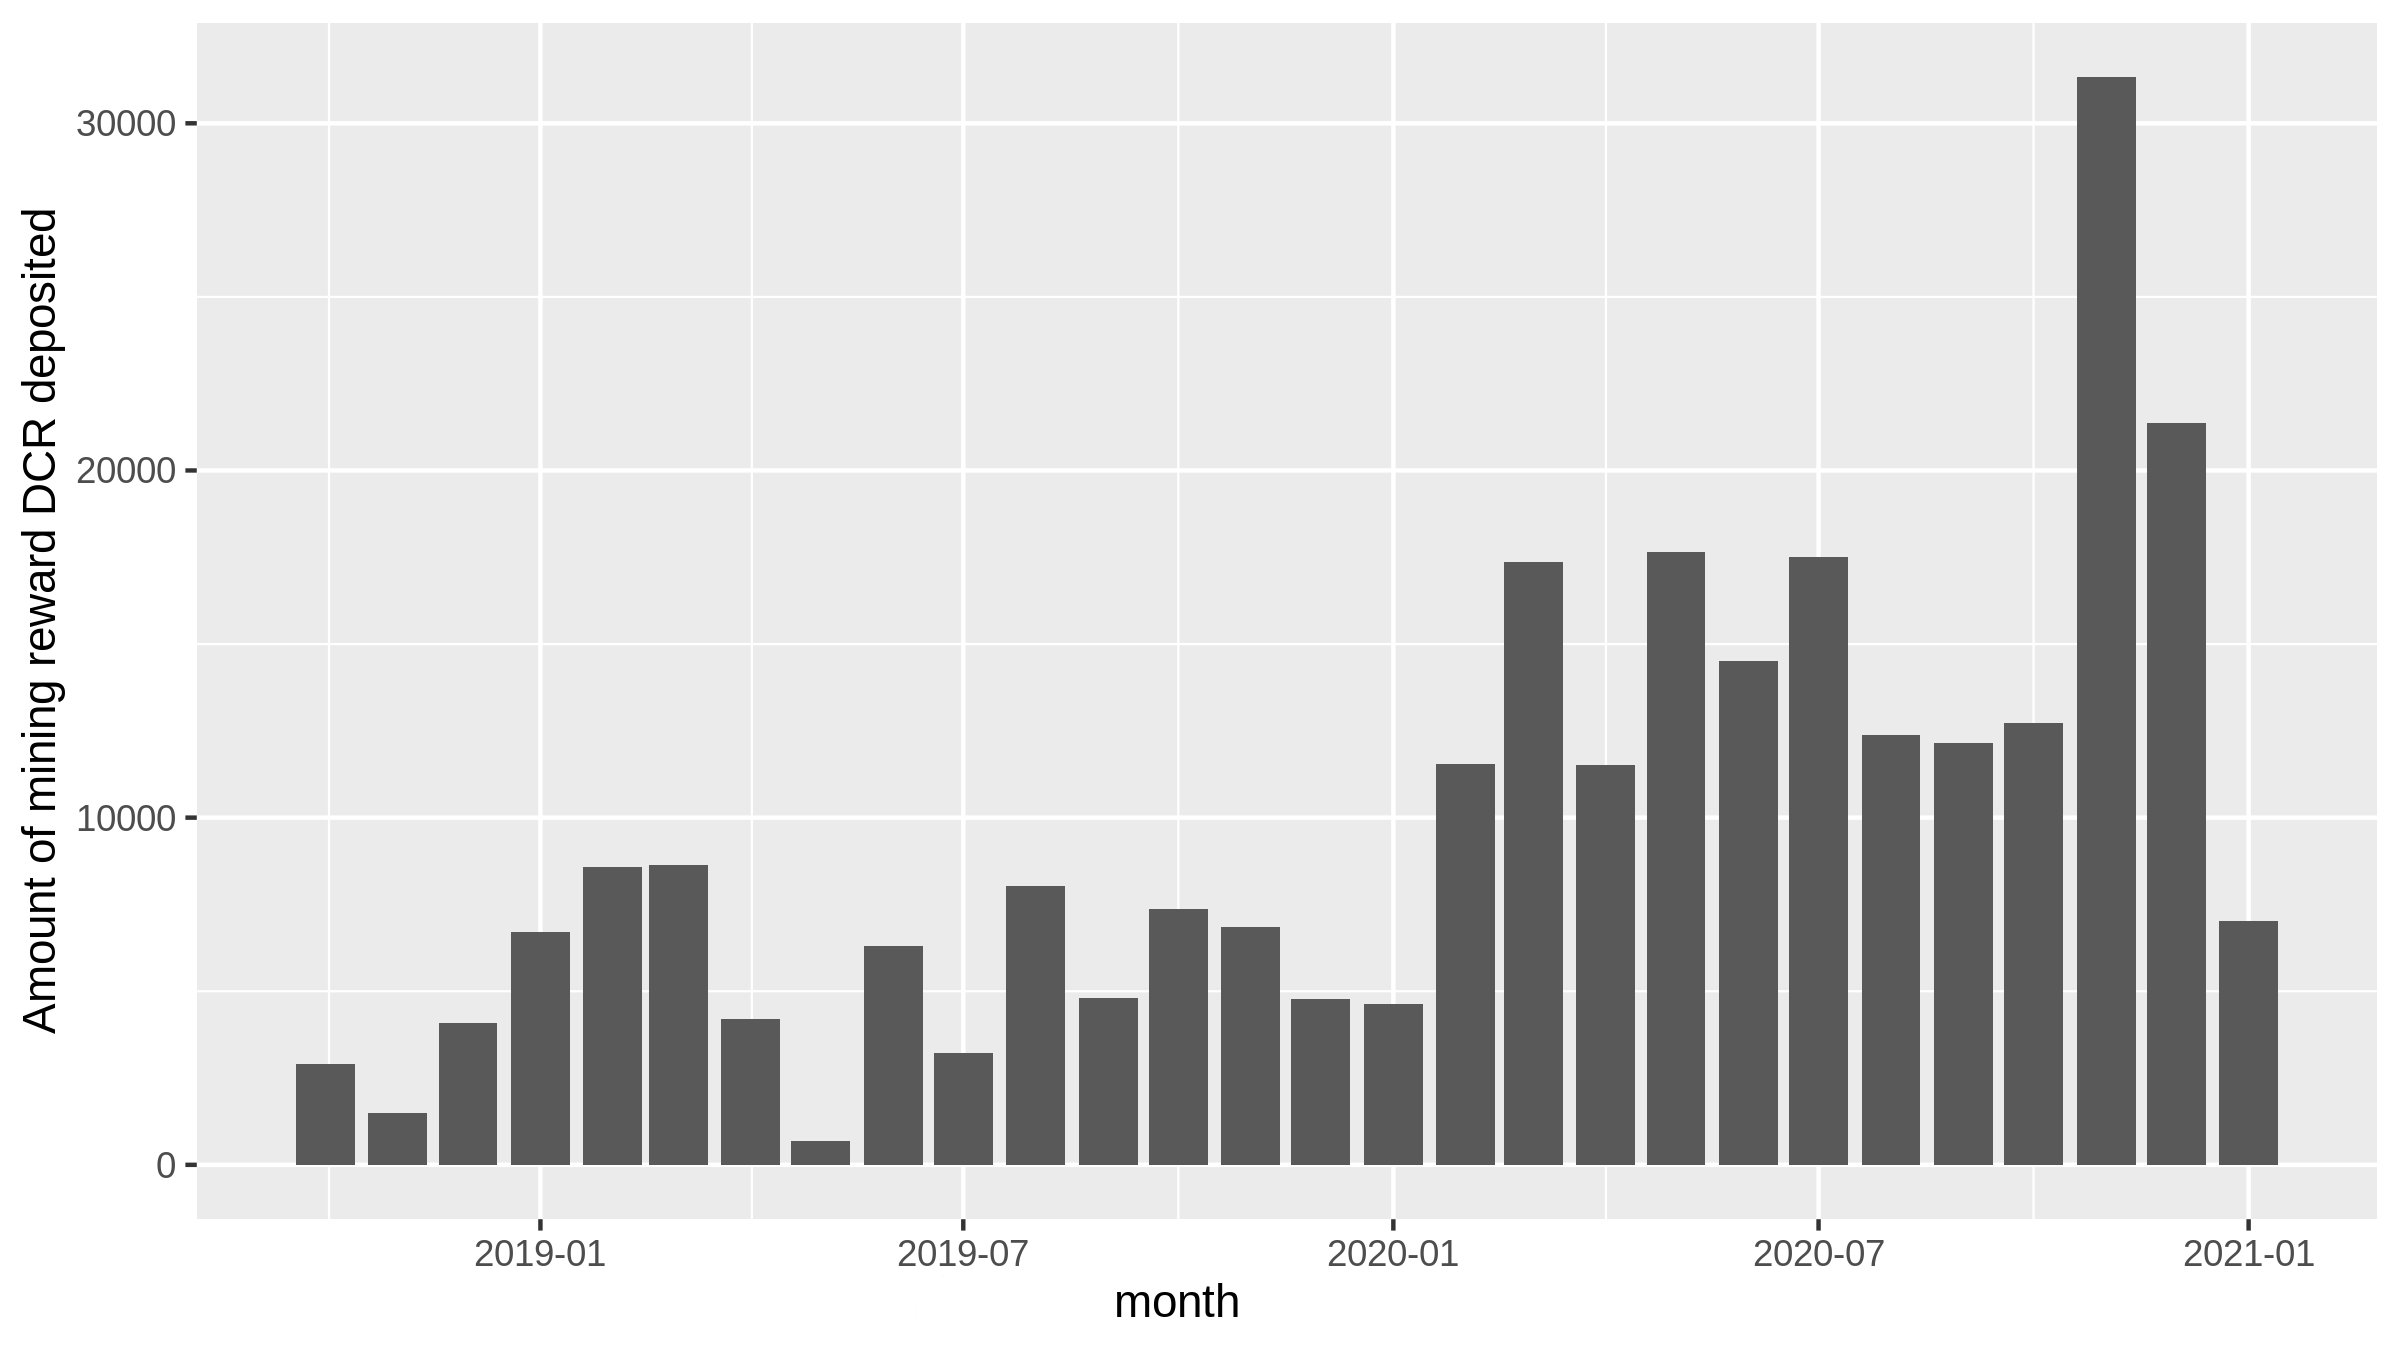
Flow of mined DCR to Binance
Minor Miner in the Voting Block
This report is not getting into the subject of major voters on the network, as this will be covered in its own report. I have developed the tooling for this already though, and as none of the top miners voted on Politeia proposals, I have selected another miner to showcase the graph.
Dcgi cluster started up in April 2018, they mined 1,621 DCR at hop 1, going up to 2,230 DCR at hop 2 - a minority of the 57K DCR to arrive in this cluster, so they were probably buying or receiving some elsewhere too.
Dcgi has also bought 2,798 tickets, and I have looked each ticket up to see 1) how many Politeia proposals it was eligible to vote on while it was live, 2) how many of these proposals it voted on, 3) whether each of its votes were in agreement with or opposition to the majority. I have labelled votes where the ticket votes in the opposite way to the majority as “contrary votes”. I was curious about the 5-10% of tickets that seem to vote Yes on crazy stuff or No on proposals that seem like easy wins, so have selected an example cluster which engages in this kind of behaviour.
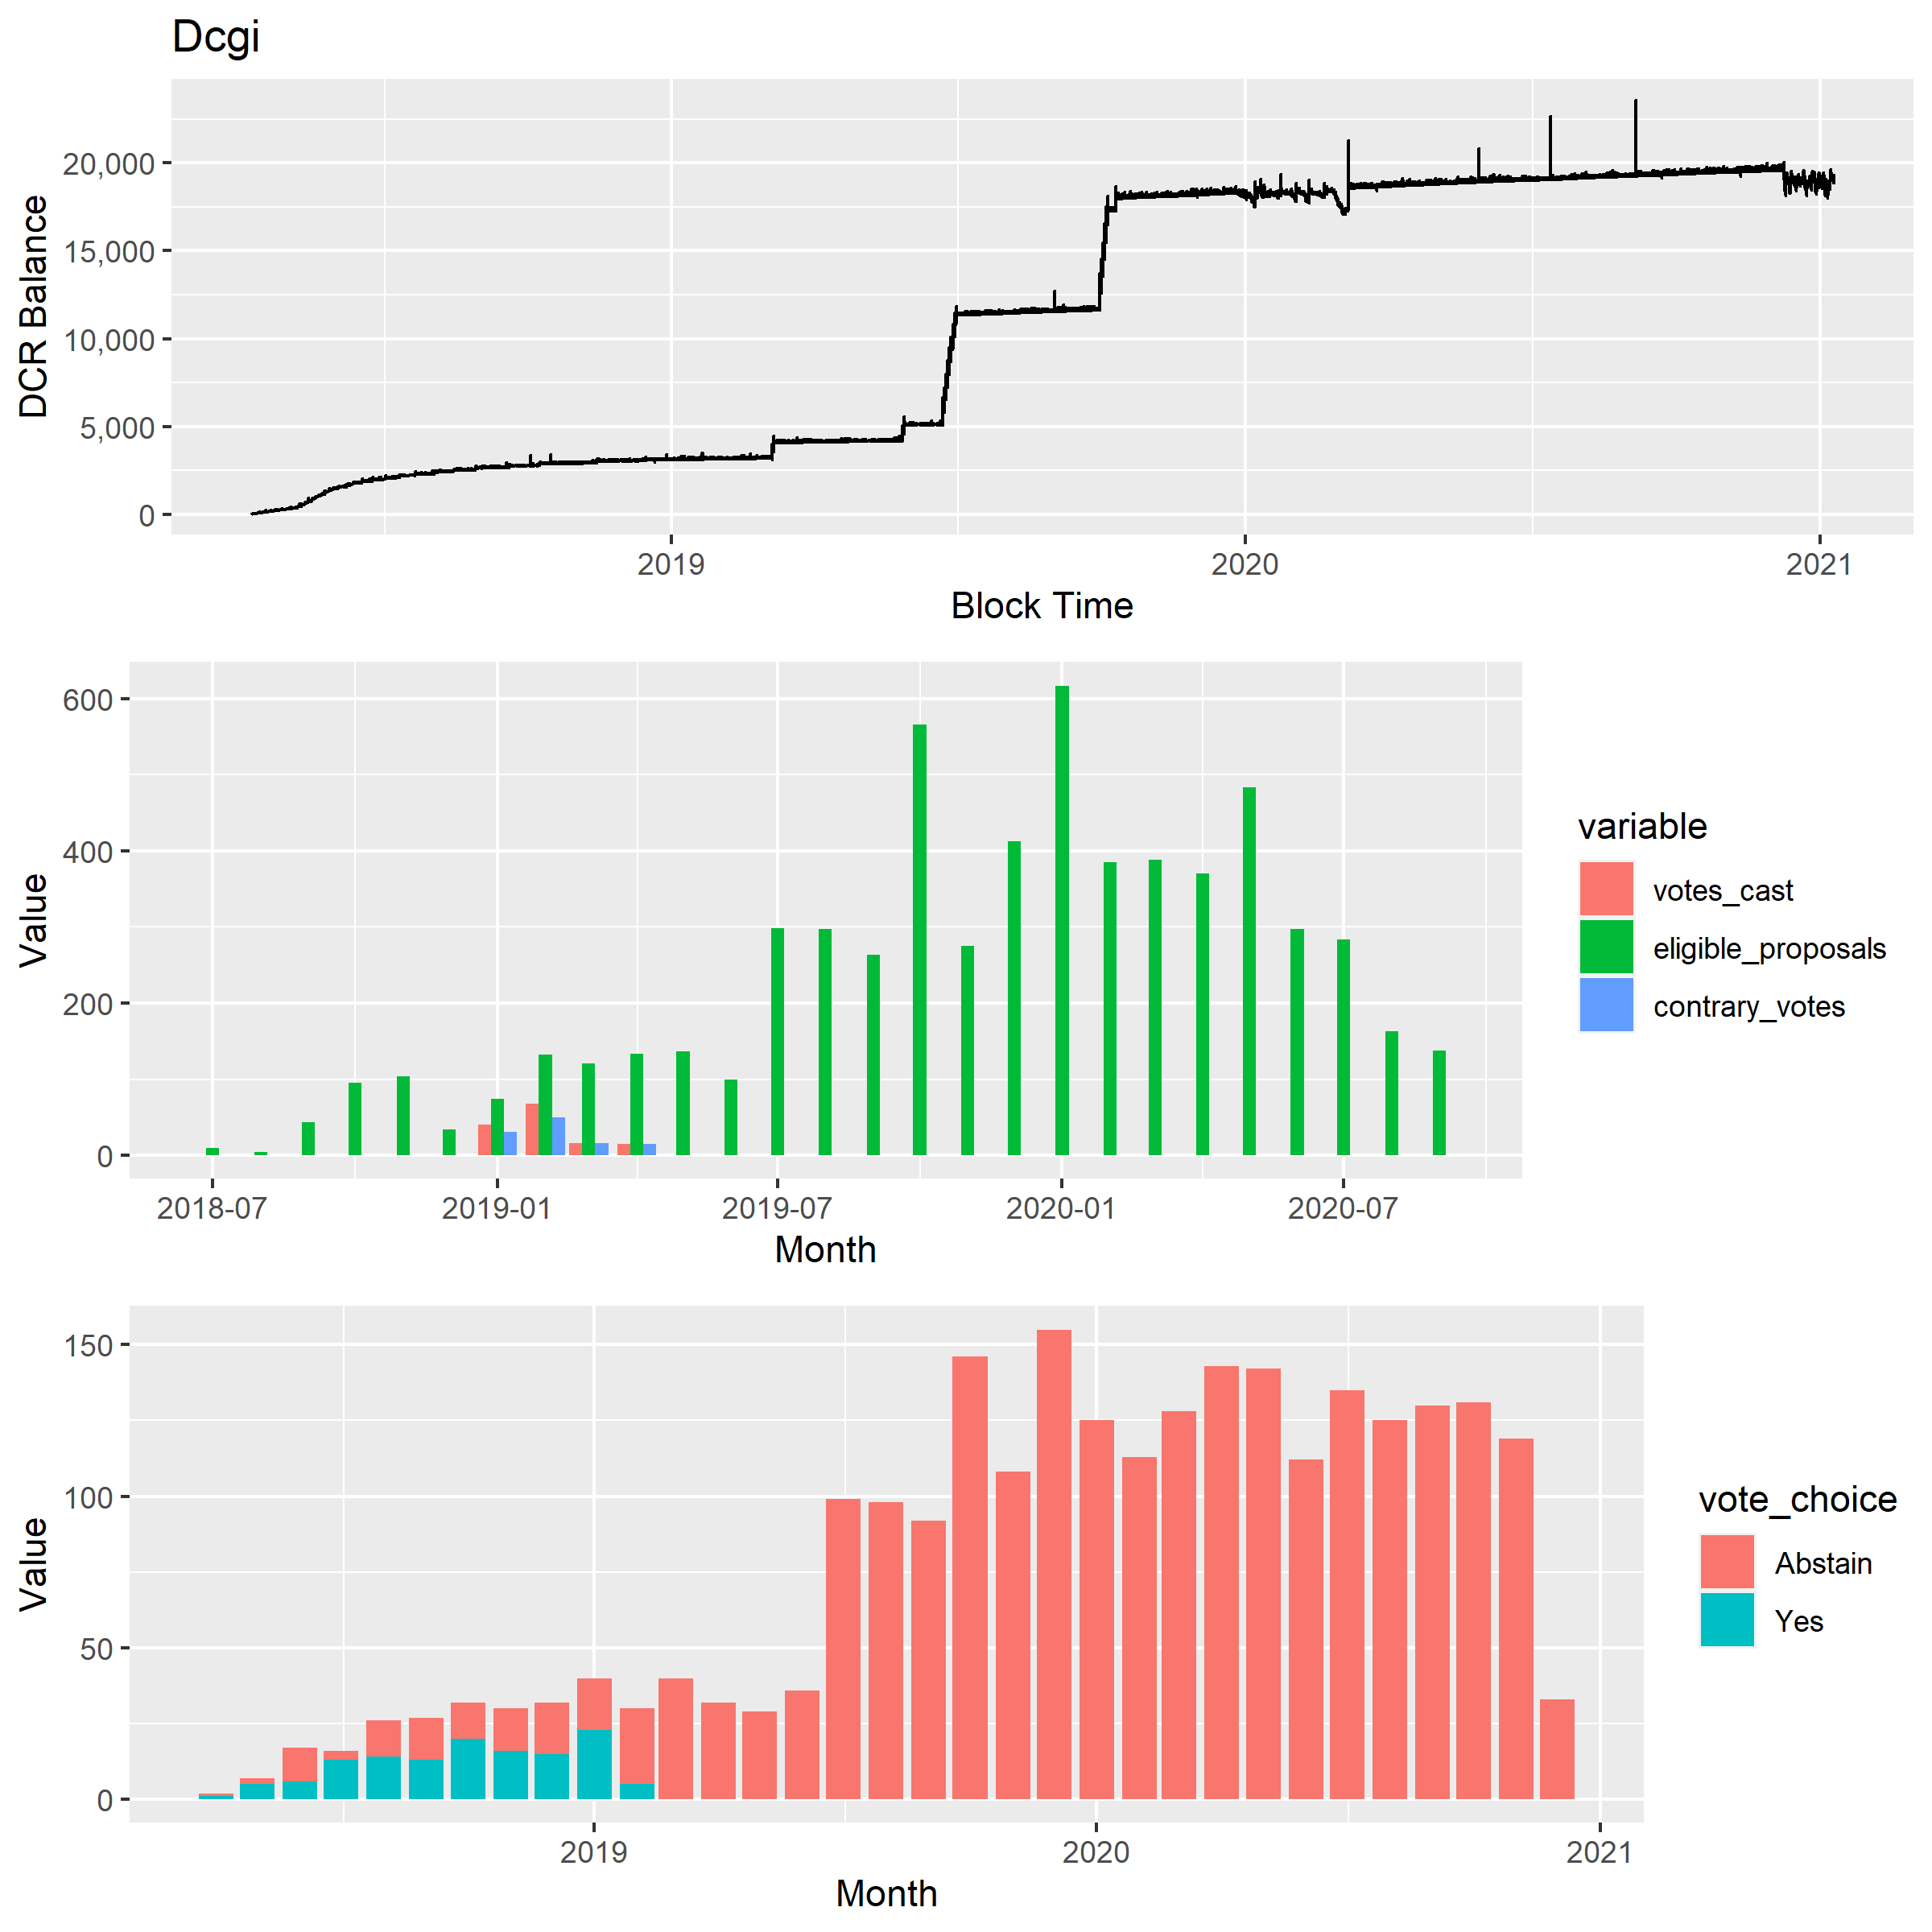
Dcgi cluster voting
In total this cluster’s tickets have had the opportunity to vote 6,223 times on Politeia proposals - they have exercised this opportunity 139 times (all No votes). Dcgi was a “contrary voter” for a while, but in this case it is likely just a side effect of only voting No on proposals - they just happened to be voting at a time when most proposals were passing (so No votes are “contrary”).
In any case, Dcgi didn’t vote on Politeia proposals for long, and after voting on 5 different proposals they stopped. Although they subsequently went on to increase their ticket buying, they no longer vote on Politeia proposals.
Dcgi then is not part of some small scale conspiracy to vote against the majority on everything, but I’ll keep looking for this kind of voter, and I have some other more experimental “contrariness” metrics in my pocket to help find them.
Something else to look out for in the voting clusters will be this pattern of dropping out from Politeia voting (which is entirely optional) while continuing to stake. If this pattern becomes common it could indicate some issue with maintaining voter engagement around Politeia proposals.

Network visualization for Dcgi cluster
Mining Cluster Comparison Table
A big table with most of the variables I produced for analysis of the clusters. See also the csv on GitHub.
| Cluster | DsiD | Dsnx | DsSW | Dsju | DscM | DsUb | DshF | DsgK | DsVy | DsgR |
|---|---|---|---|---|---|---|---|---|---|---|
| cluster_address_count | 1109 | 19 | 3337 | 2084 | 874 | 2 | 3168 | 760 | 845 | 1304 |
| transactions | 54928 | 39643 | 49266 | 23301 | 16067 | 1987 | 137185 | 2182 | 3726 | 17817 |
| first_tx | 2019-01-02 13:08:18 | 2019-07-20 12:13:01 | 2018-03-05 08:32:33 | 2019-03-02 18:29:39 | 2018-09-26 11:33:41 | 2018-05-09 12:24:59 | 2018-05-16 09:10:02 | 2018-12-01 02:34:00 | 2019-02-25 07:39:00 | 2018-09-28 12:24:41 |
| last_tx | 2021-01-09 21:59:13 | 2021-01-09 21:45:39 | 2021-01-09 19:10:40 | 2021-01-09 21:58:25 | 2021-01-09 04:05:26 | 2021-01-09 01:37:08 | 2021-01-09 21:45:39 | 2020-04-15 11:14:48 | 2021-01-09 03:15:39 | 2021-01-09 19:35:30 |
| pow_hop0 | 488802.91807524 | 347626.82792268 | 519880.98846996 | 201669.66452286 | 159915.29580411 | 0 | 73014.84963746 | 0 | 0 | 112227.12866917 |
| pow_hop1 | 6487.28770665796 | 4393.73631189384 | 40817.8872229146 | 9146.47306420091 | 6163.74359437886 | 526342.235081775 | 291982.029782227 | 201472.655499916 | 190696.463493561 | 141152.518452055 |
| pow_hop2 | 119.32268602015 | 485.362020482757 | 32399.7311937084 | 430.387230314041 | 2714.72784295878 | 39664.0329766306 | 471104.153120638 | 146226.781403411 | 37087.2377048399 | 198639.698791613 |
| blocks_mined | 53766 | 38923 | 45960 | 21187 | 15140 | 0 | 8247 | 0 | 0 | 10877 |
| maxbalance | 6573.88078908 | 4919.01649251 | 13670.31809715 | 4266.63201732 | 17421.33981517 | 1615.61617345 | 289548.92370795 | 8250.18272714 | 3829.3854482 | 62592.65358853 |
| total_in_not_pow | 5278.44548232 | 118787.86978701 | 38312.8911935 | 34.51259811 | 28944.07306979 | 661155.87498336 | 13602470.6717559 | 698999.52248599 | 247332.01784814 | 2626174.34346062 |
| dcr_staked | 0 | 0 | 846307.0359496 | 0 | 27581.4768304 | 0 | 0 | 0 | 0 | 0 |
| tickets | 0 | 0 | 622 | 0 | 22 | 0 | 0 | 0 | 0 | 0 |
| staking_income | 0 | 0 | 587.02419153 | 0 | 21.57025368 | 0 | 0 | 0 | 0 | 0 |
| votes | 0 | 0 | 618 | 0 | 21 | 0 | 0 | 0 | 0 | 0 |
| eligible_proposals | 0 | 0 | 1467 | 0 | 54 | 0 | 0 | 0 | 0 | 0 |
| proposal_votes | 0 | 0 | 0 | 0 | 0 | 0 | 0 | 0 | 0 | 0 |
| yes_votes | 0 | 0 | 0 | 0 | 0 | 0 | 0 | 0 | 0 | 0 |
| no_votes | 0 | 0 | 0 | 0 | 0 | 0 | 0 | 0 | 0 | 0 |
| contrary_votes | 0 | 0 | 0 | 0 | 0 | 0 | 0 | 0 | 0 | 0 |
| agenda_eligible | 0 | 0 | 618 | 0 | 21 | 0 | 0 | 0 | 0 | 0 |
| agenda_yes | 0 | 0 | 618 | 0 | 21 | 0 | 0 | 0 | 0 | 0 |
| agenda_no | 0 | 0 | 0 | 0 | 0 | 0 | 0 | 0 | 0 | 0 |
| dcr_mixed | NA | NA | NA | NA | NA | NA | NA | NA | NA | NA |
| to_binance | 114.6936362 | 1216.43768337 | 44861.1836671 | 0 | 11175.93465711 | 71500.37729076 | 832299.64462136 | 0 | 33043.20657038 | 130832.71537083 |
| to_bittrex | 98.65456296 | 0 | 34434.88514938 | 0 | 1657.2625905 | 2543.4779432 | 348437.53859333 | 0 | 143.59756099 | 2360.63310245 |
| to_poloniex | 40.10091568 | 0 | 19174.41999277 | 0 | 443.70869648 | 1636.74170974 | 99224.39838695 | 0 | 231.50077396 | 6.33034771 |
| airdrop_hop0 | 0 | 0 | 0 | 0 | 0 | 0 | 0 | 0 | 0 | 0 |
| airdrop_hop1 | 0 | 0 | 0 | 0 | 0 | 0 | 174 | 0 | 0 | 0 |
| airdrop_hop2 | 0 | 0 | 0 | 0 | 0 | 0 | 147.198780009686 | 0 | 0 | 0 |
| founders_hop0 | 0 | 0 | 0 | 0 | 0 | 0 | 0 | 0 | 0 | 0 |
| founders_hop1 | 0 | 0 | 0 | 0 | 0 | 0 | 0 | 0 | 0 | 0 |
| founders_hop2 | 0 | 0 | 0 | 0 | 0 | 0 | 0 | 0 | 0 | 0 |
| treasury_hop0 | 0 | 0 | 0 | 0 | 0 | 0 | 0 | 0 | 0 | 0 |
| treasury_hop1 | 0 | 0 | 0 | 0 | 0 | 0 | 1132.00755691464 | 0 | 0 | 0 |
| treasury_hop2 | 0 | 0.196167169291414 | 0 | 0 | 0 | 0 | 678.827624698592 | 0 | 0 | 10 |
| output_addresses | 189 | 32 | 4394 | 32 | 809 | 1377 | 3166 | 87 | 1044 | 944 |
| output_rows | 5134 | 615 | 285092 | 2142 | 76242 | 116410 | 13466 | 1362 | 23180 | 1592 |
| address_table_rows | 109525 | 78930 | 99013 | 46332 | 32094 | 3942 | 507403 | 4204 | 5921 | 43642 |
Zooming back out
While I was writing all of that up and getting those network graphs drawn just right, the full clustering of PoW reward hop 1 and 2 transaction destinations completed. All of the addresses that have received DCR within 3 hops of the coinbase have been considered, and I have looked to see if they cluster with any other addresses. In total there were 35,890 addresses in the set, and they yielded 13,411 clusters - but more than half of these (8,559) are single-use addresses that don’t cluster with any other addresses and have a maximum of 2 transactions (1 in and 1 out). These addresses together are not too significant, getting 23 hop 1 DCR, 68K at hop 2 and 132K hop 3. One way of reading this is that it sets a likely maximum on the number of different entities mining DCR in this period: 4,852. Within this number however there are likely some miners that use more than one wallet, or use fresh addresses often enough that their activity has fallen into more than one cluster.
To conclude with, I wanted to produce a more practical network visualization for PoW rewards, that conveys information in a more straightforward way. I set a target to show all of the PoW reward movements for a period for 3 hops. The period that ended up working was about 3 months (from October 1st 2020 to Jan 9th 2021), but I had to prune out a lot of small transactions (anything worth less than 10 DCR) and addresses (any that received less than 1,000 DCR) to keep it readable. This uses a tree layout, with the addresses which received PoW rewards directly from the coinbase being placed as the top layer. Moving down the graph, the DCR flows to transaction then address, transaction then address - with some going to Binance (no other exchange hits in this set) and some being staked - as a bonus you can also see some of the DCR from different pools meeting in the Binance hot wallet.
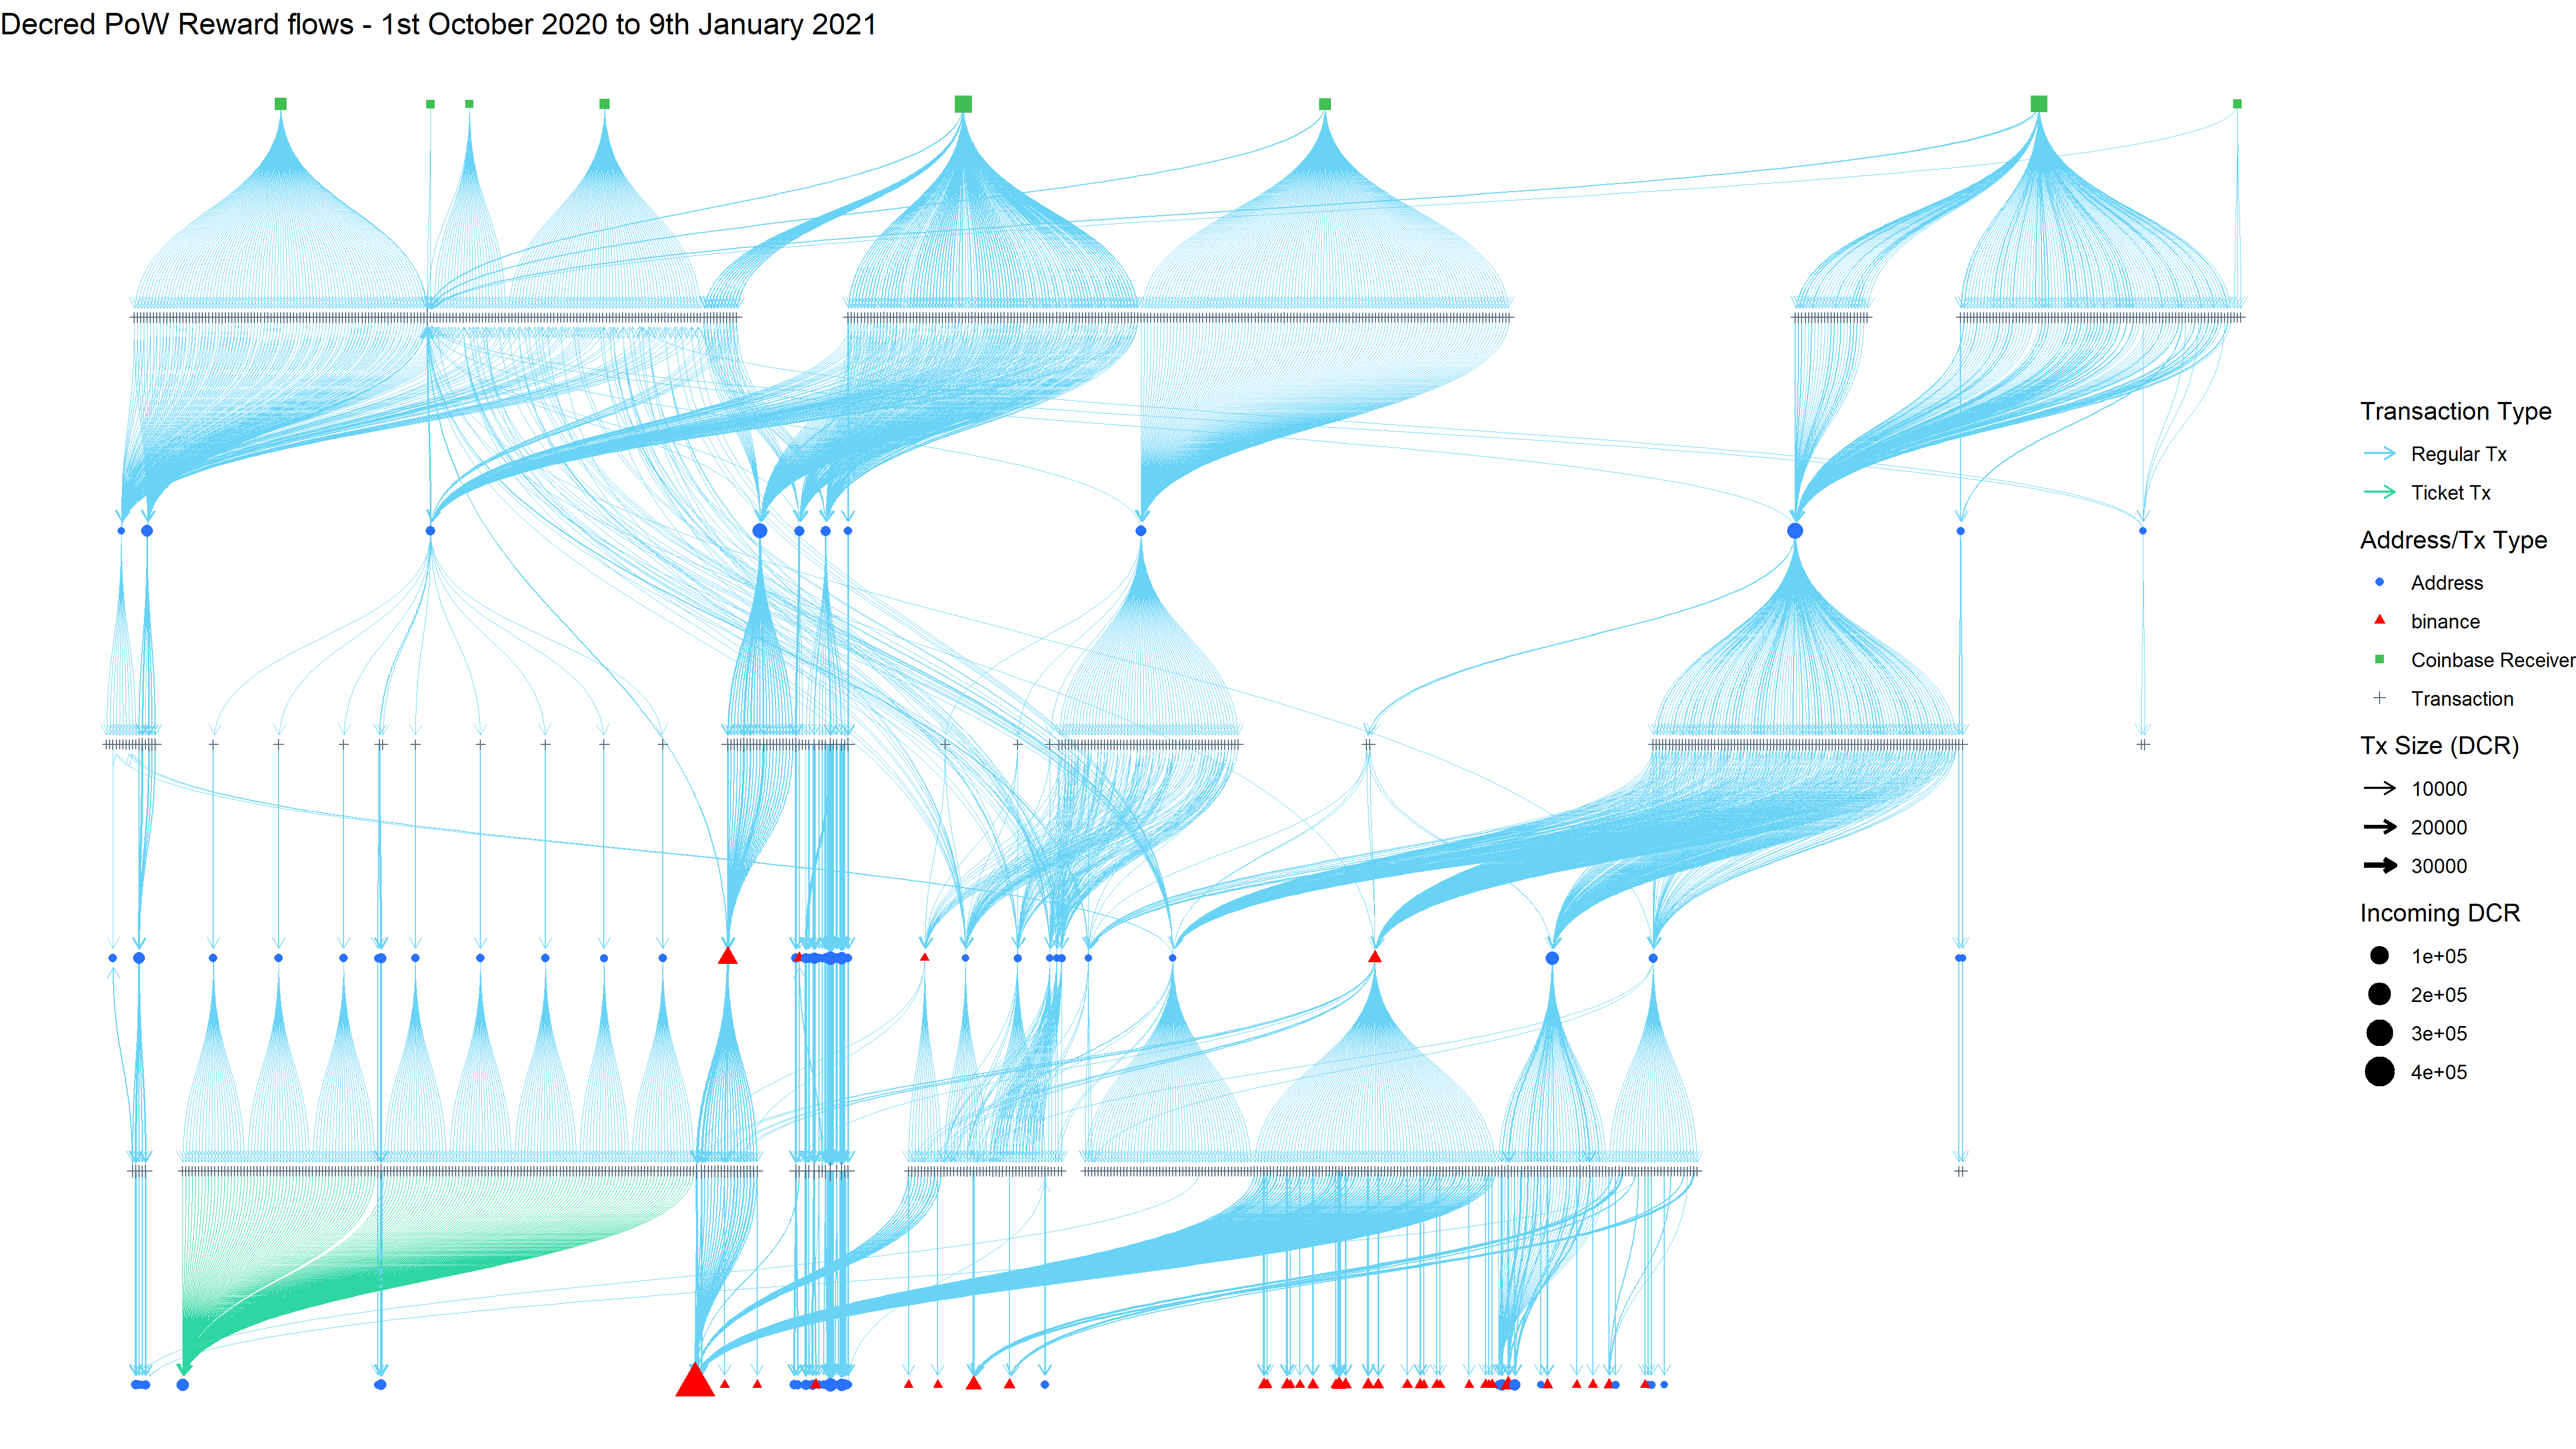
~100 days and 3 hops of PoW reward flows
This post focuses on the early lifecycle of mined DCR, as it flows to exchanges, OTC counters or the ticket pool. Up next could be a closer look at exchanges, voters or the mixing pool - the order depends in part on what I make the best progress with, but there should be a more regular flow of on chain reports for a while now after the long gap since the initial report. This research is funded by the Decred Treasury (cheers stakeholders), and my plans for forthcoming research are contingent on funding being renewed through a forthcoming proposal.


Comments ()